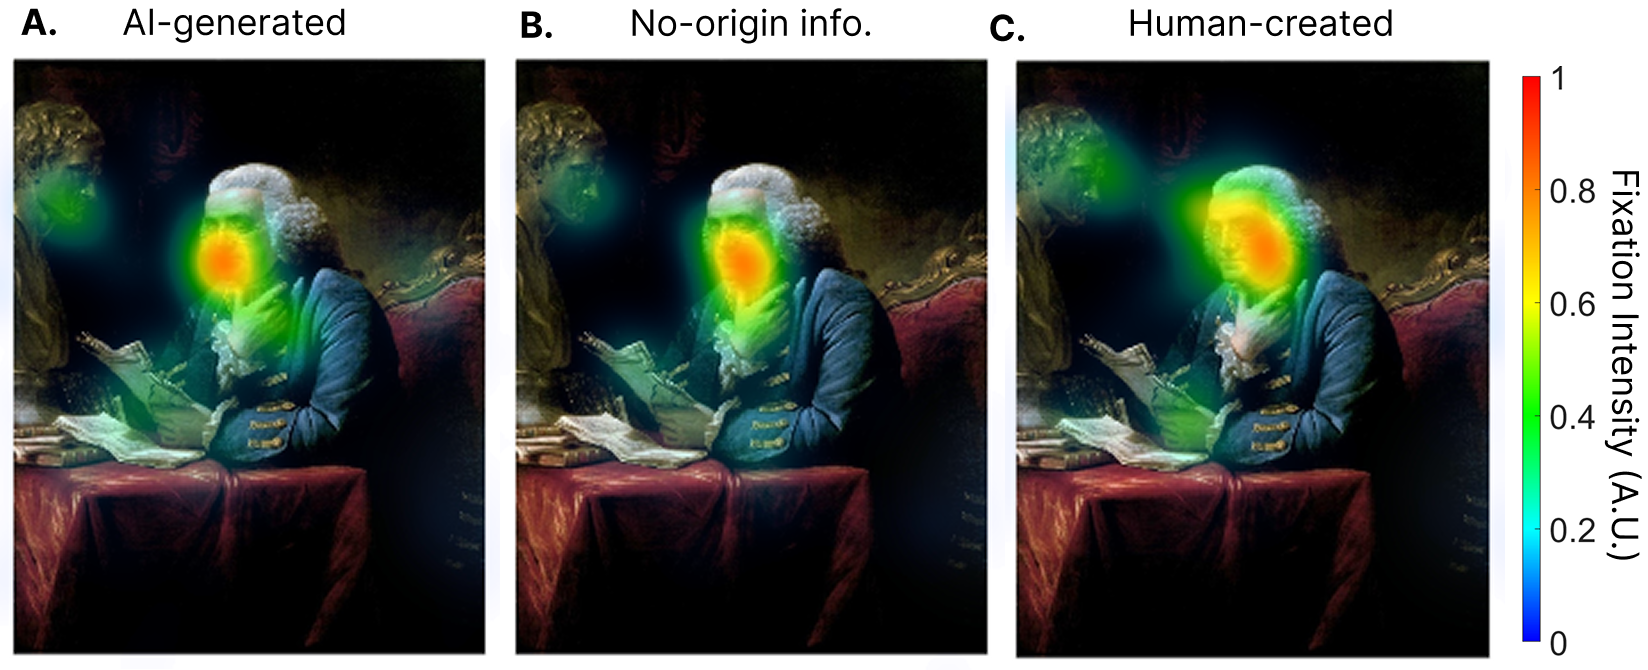
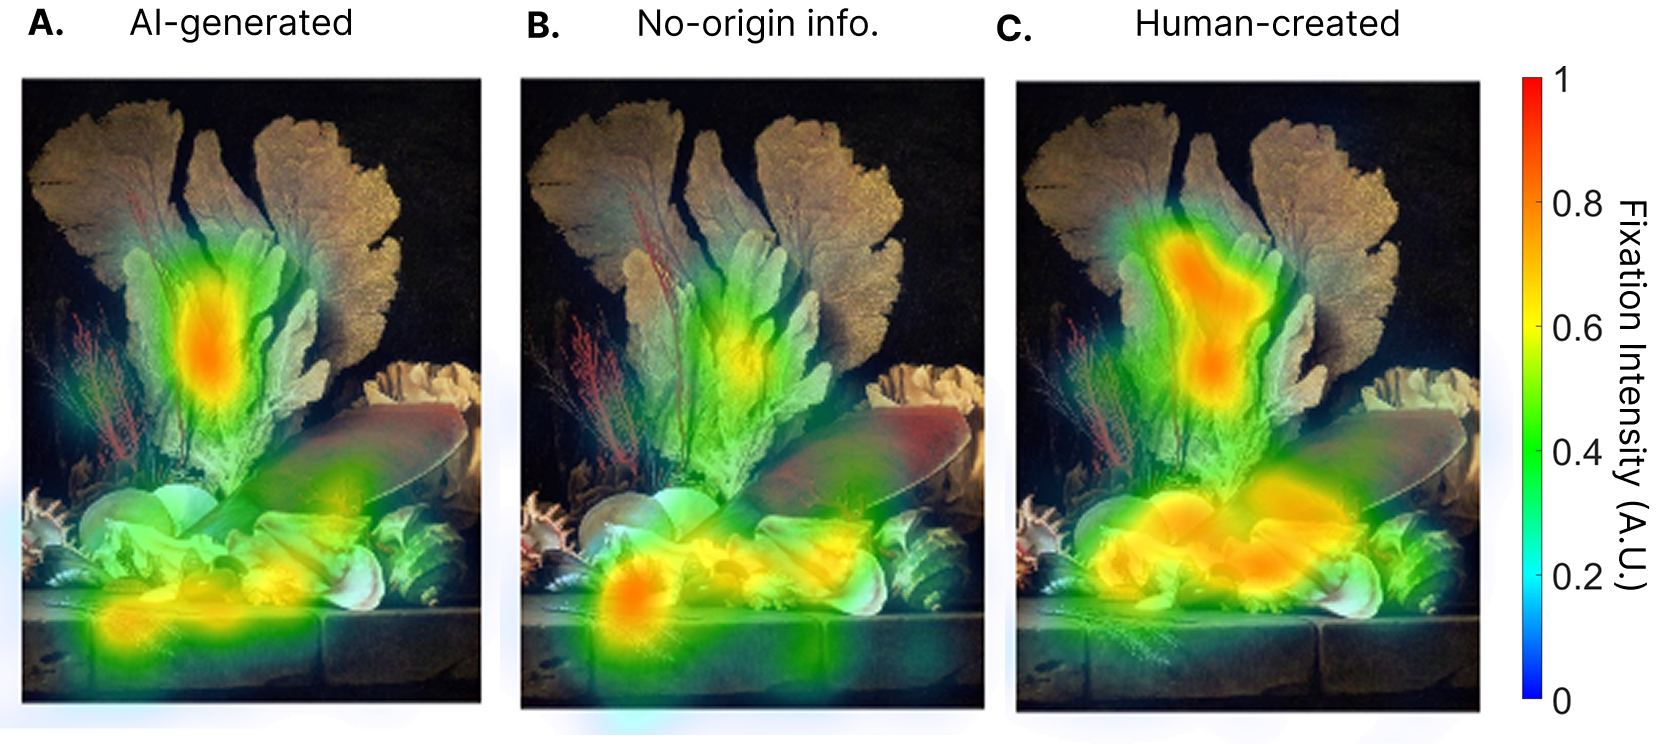
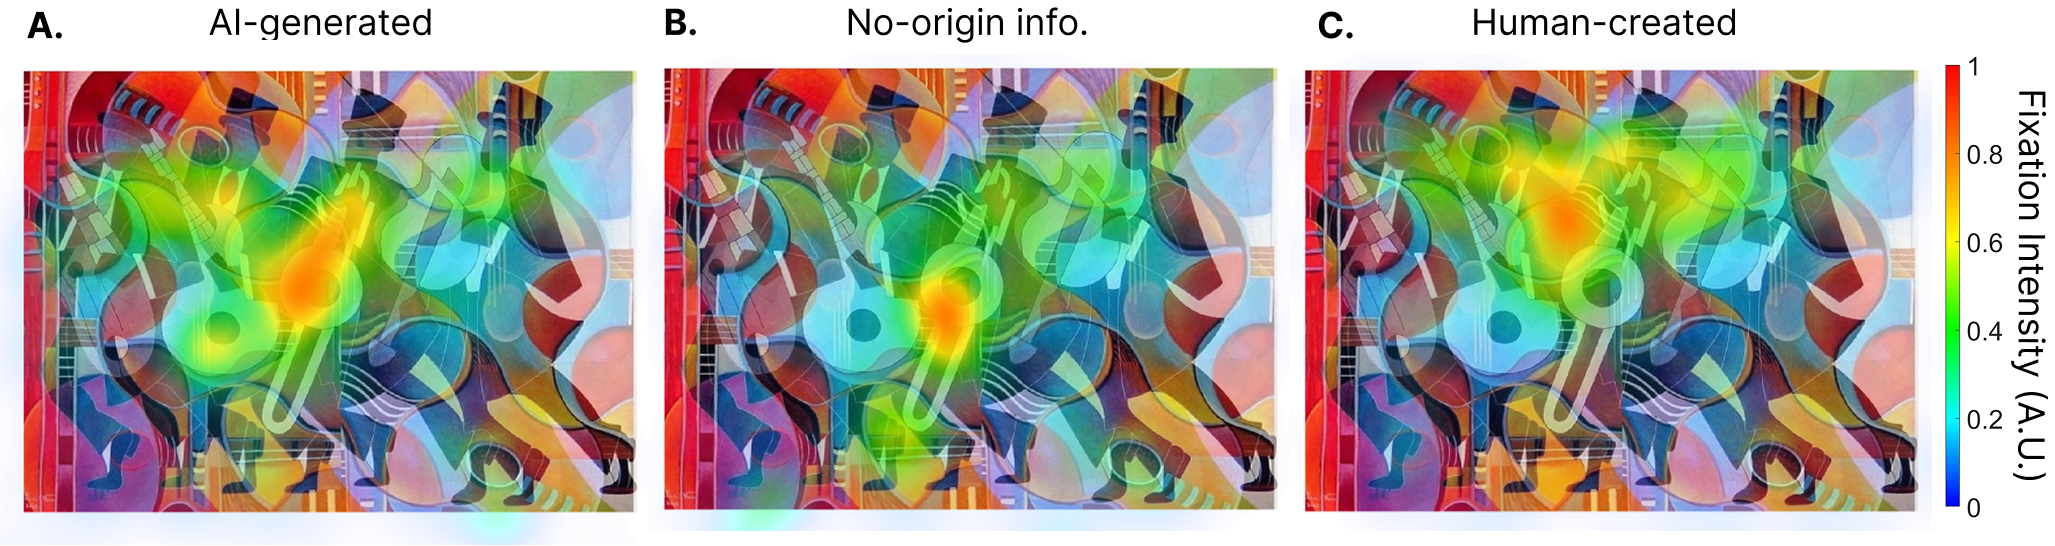
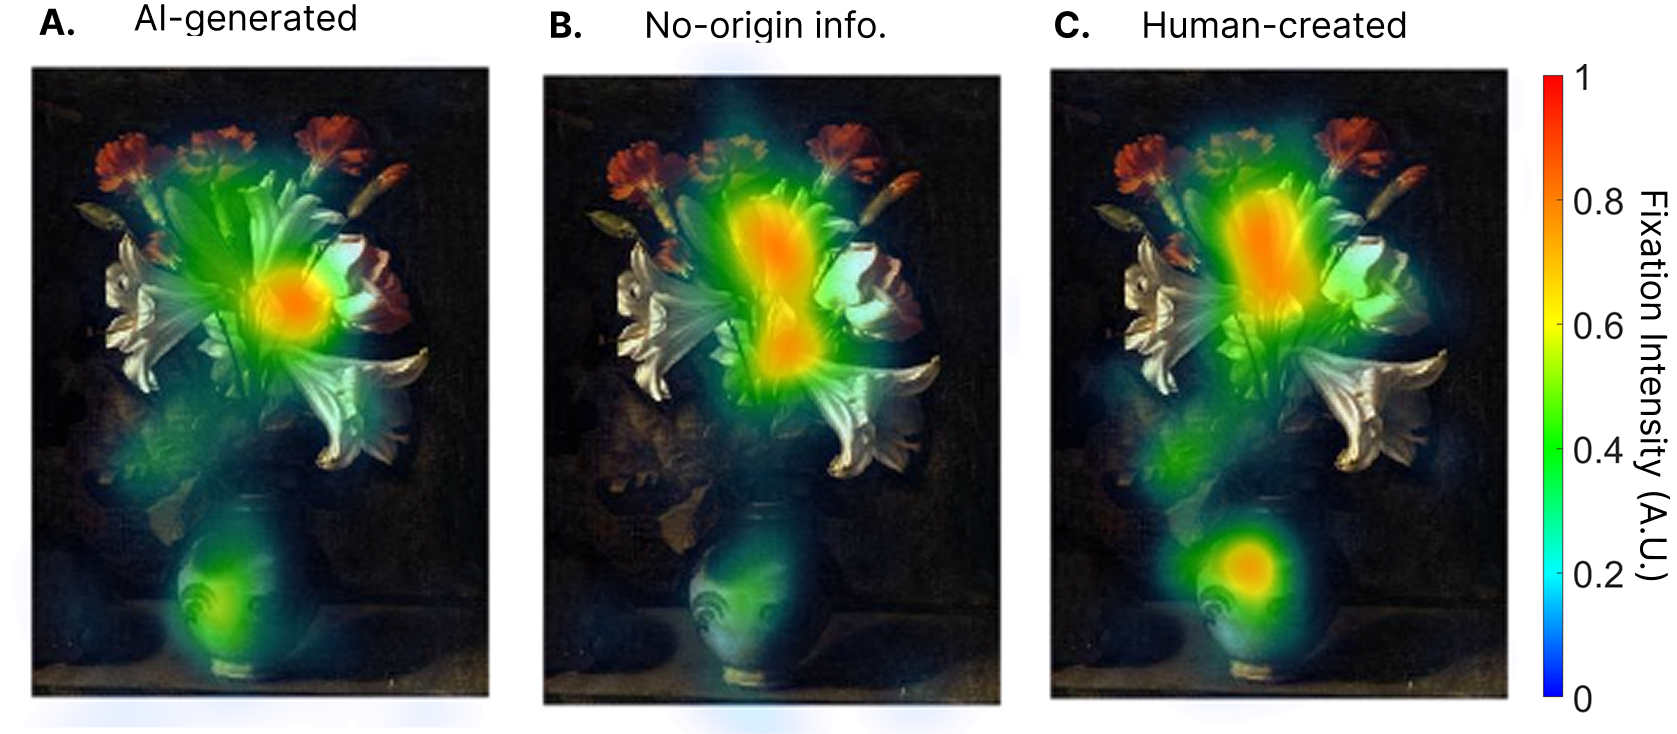
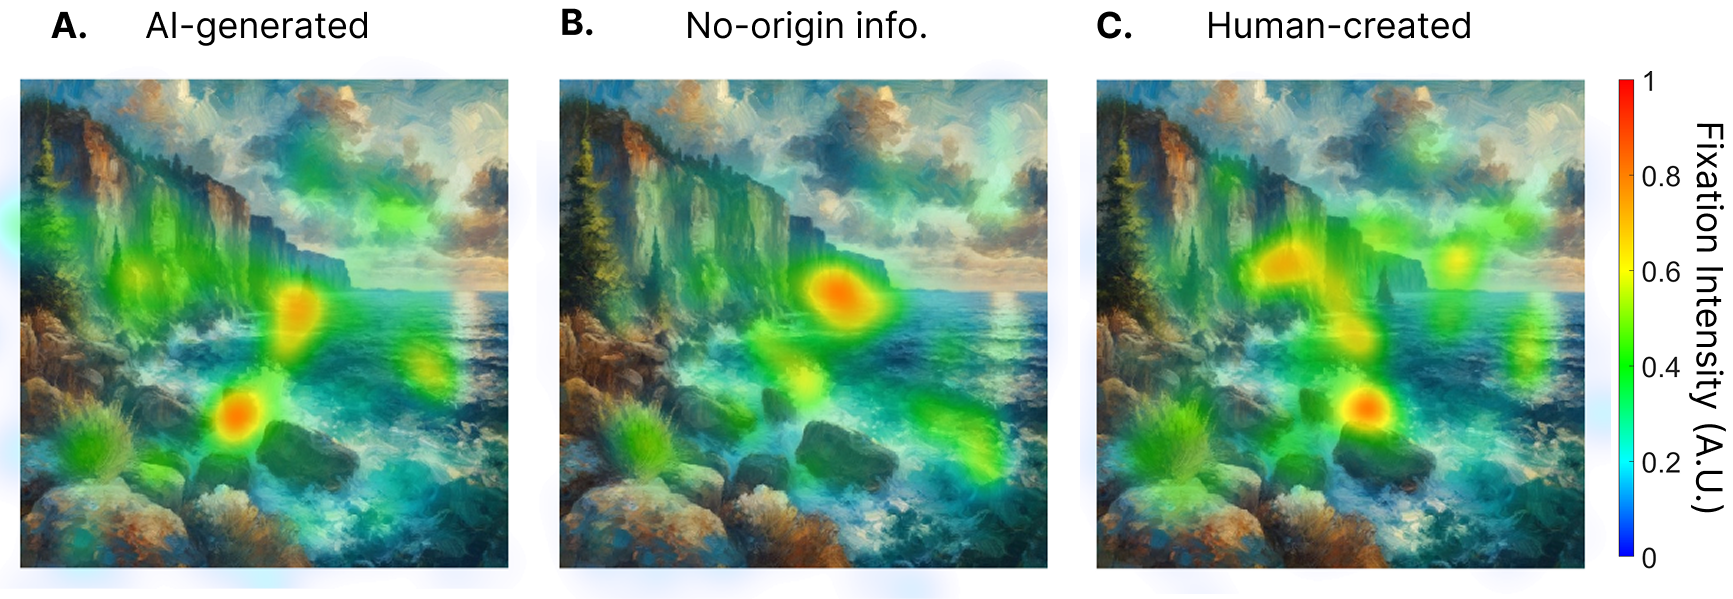
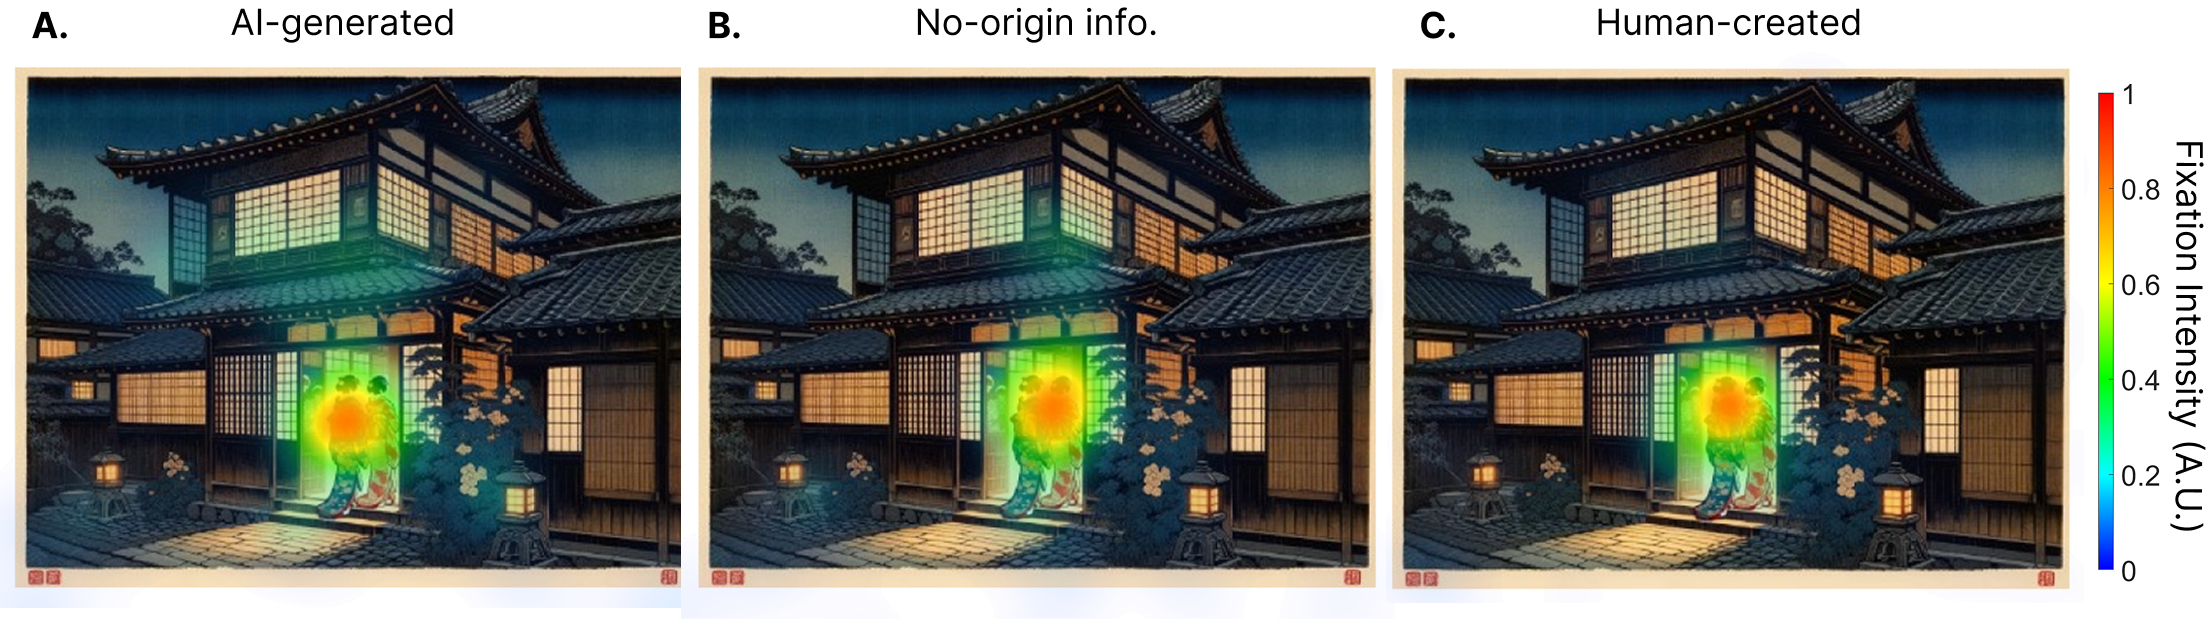
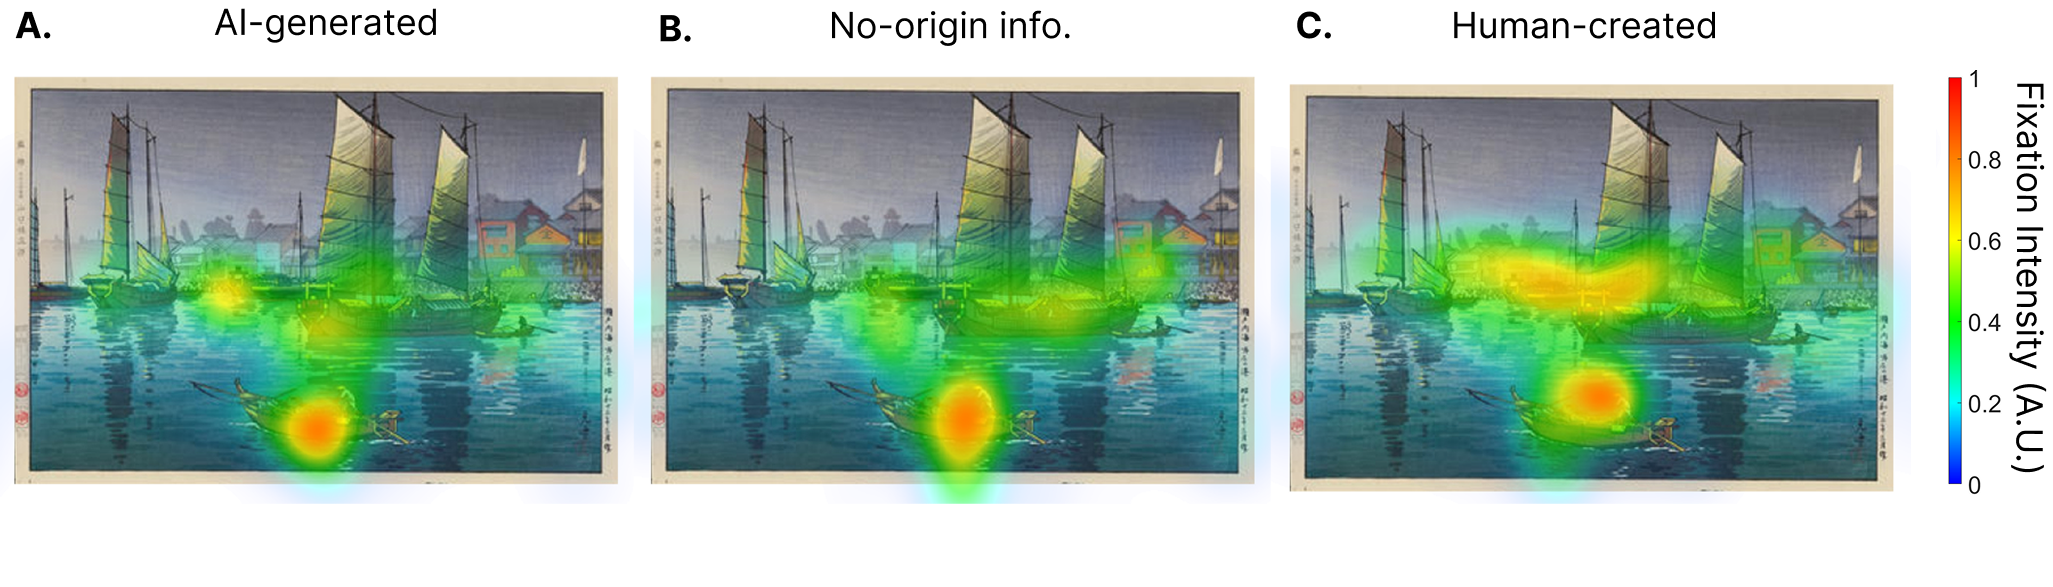
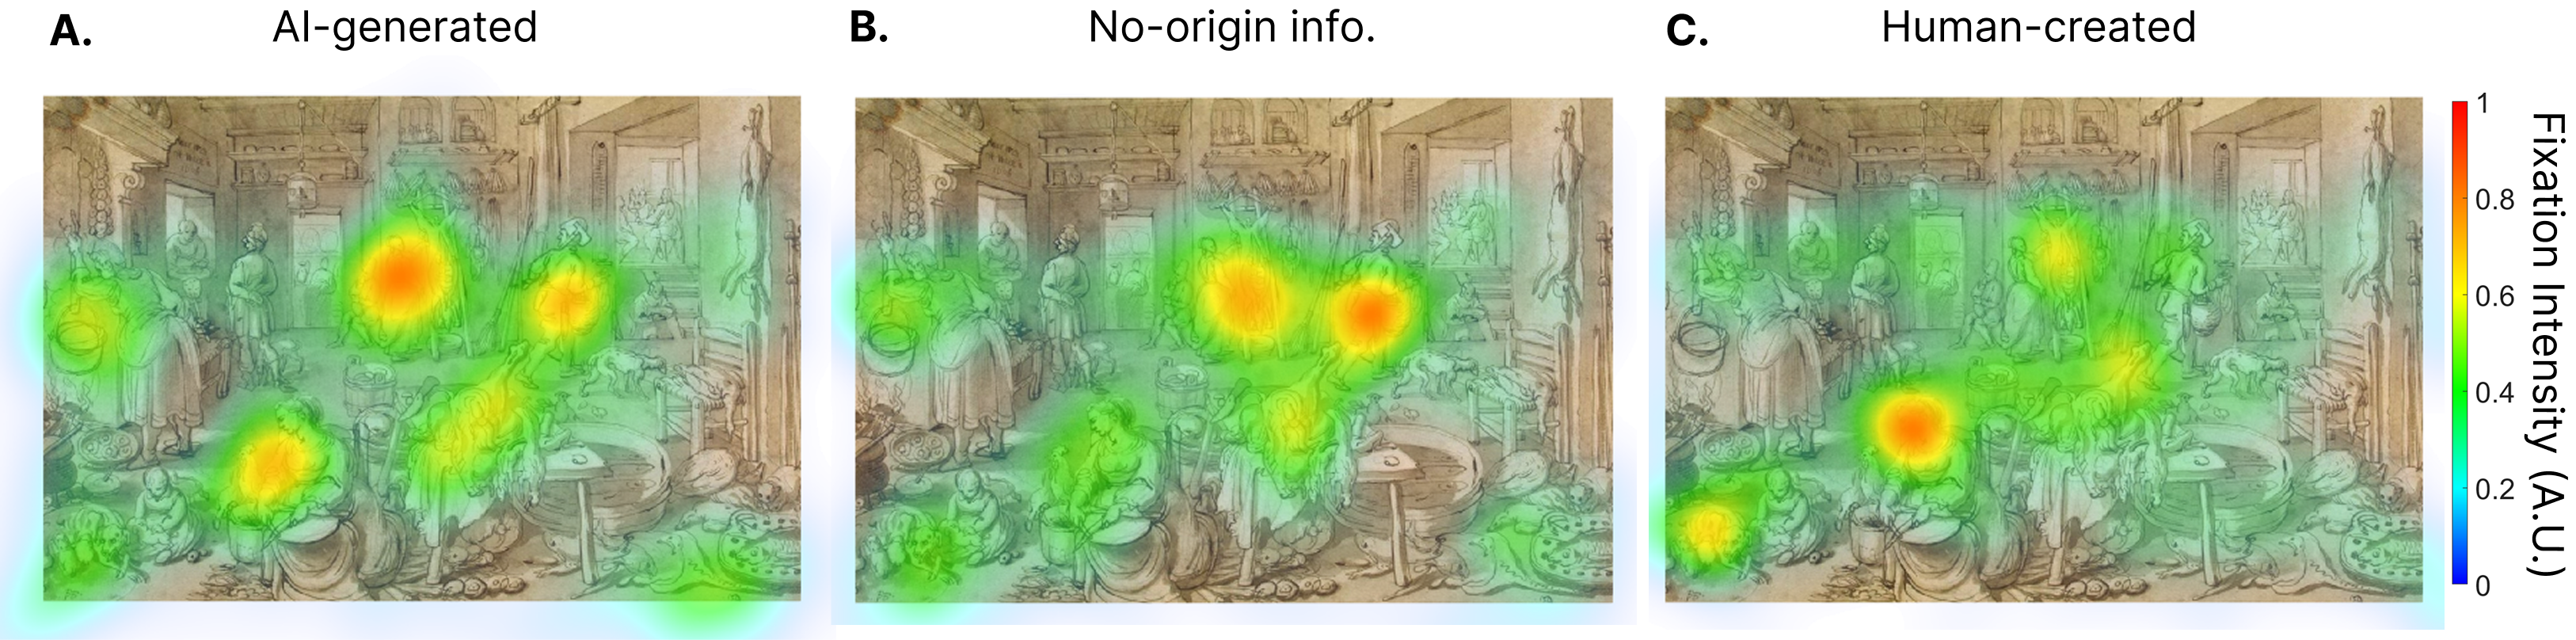
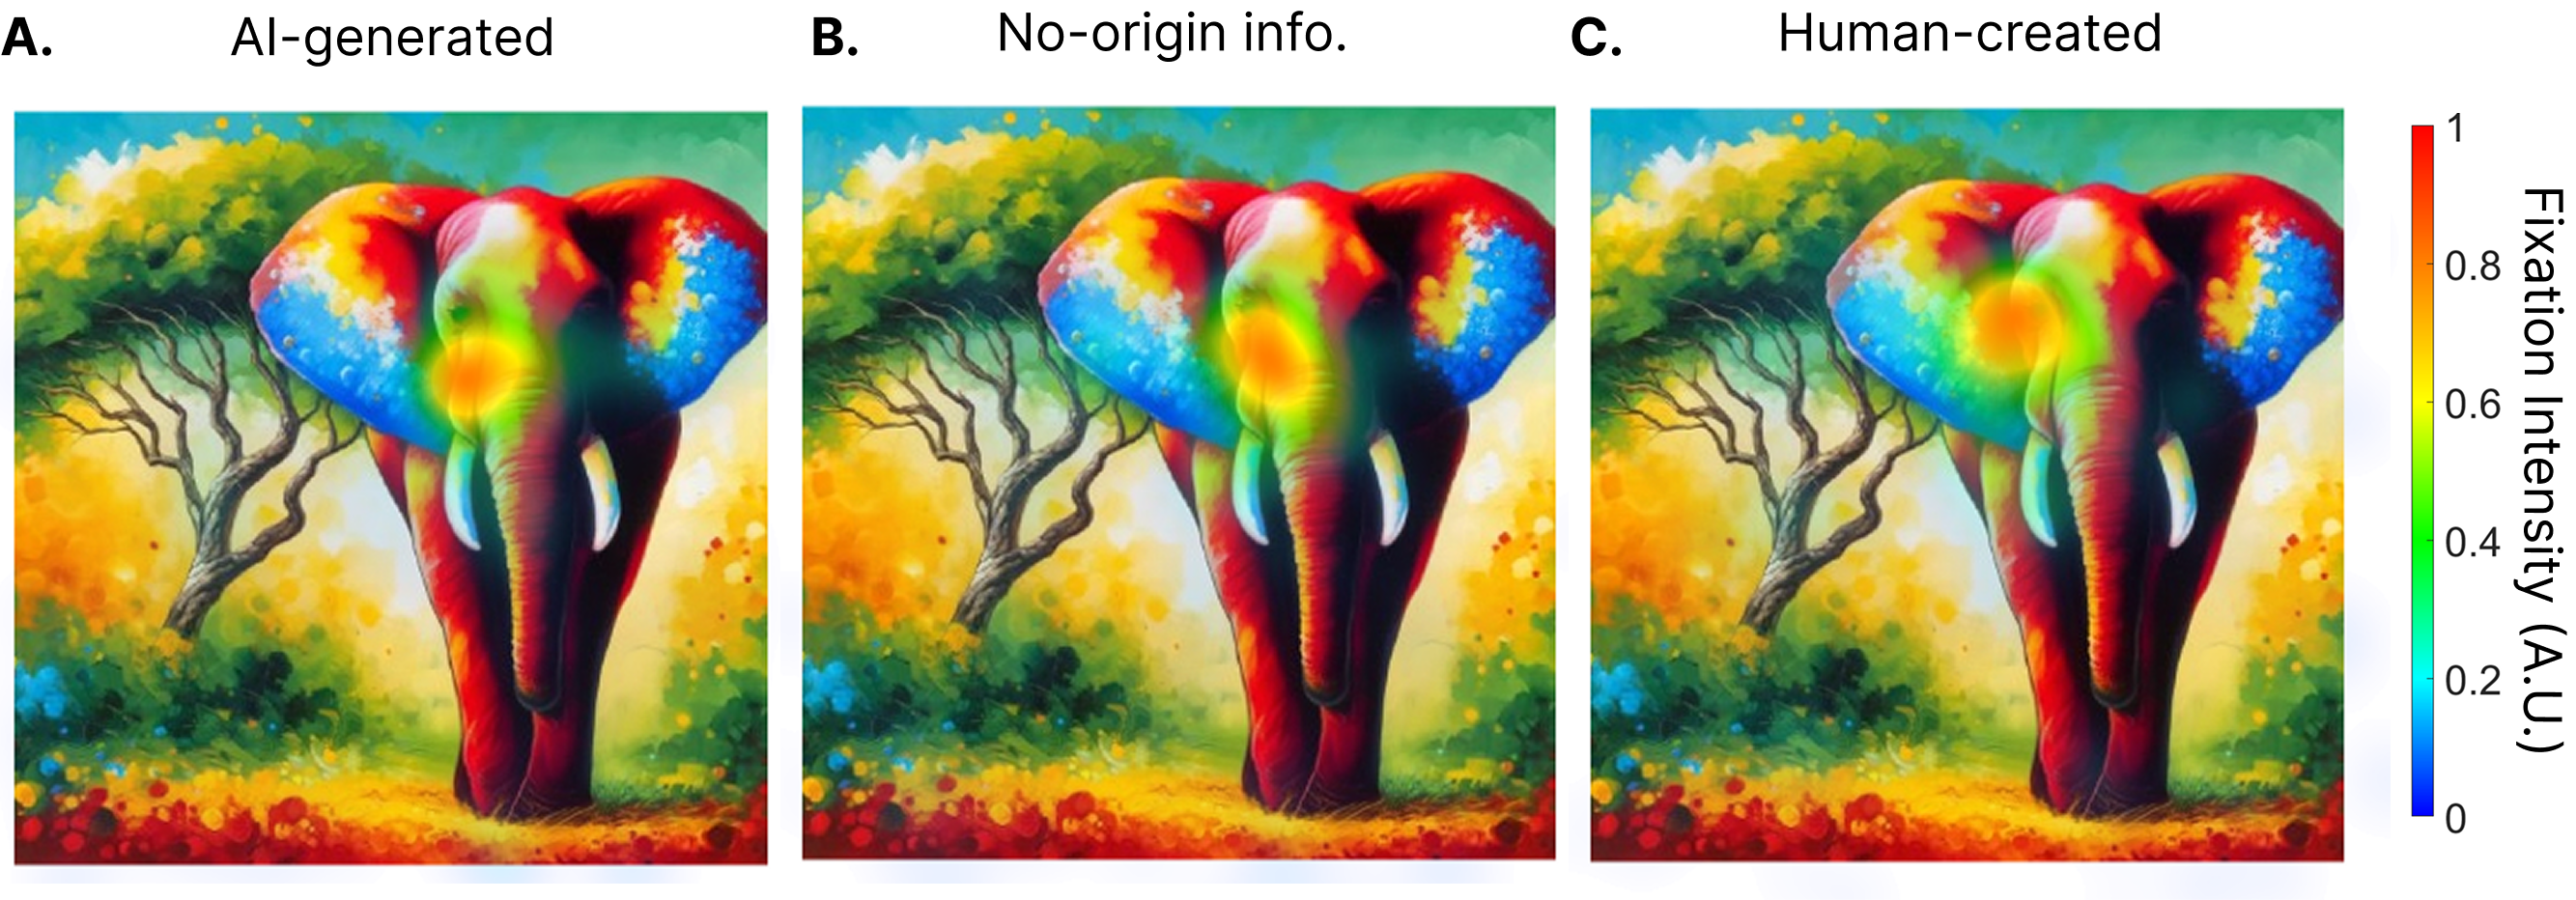
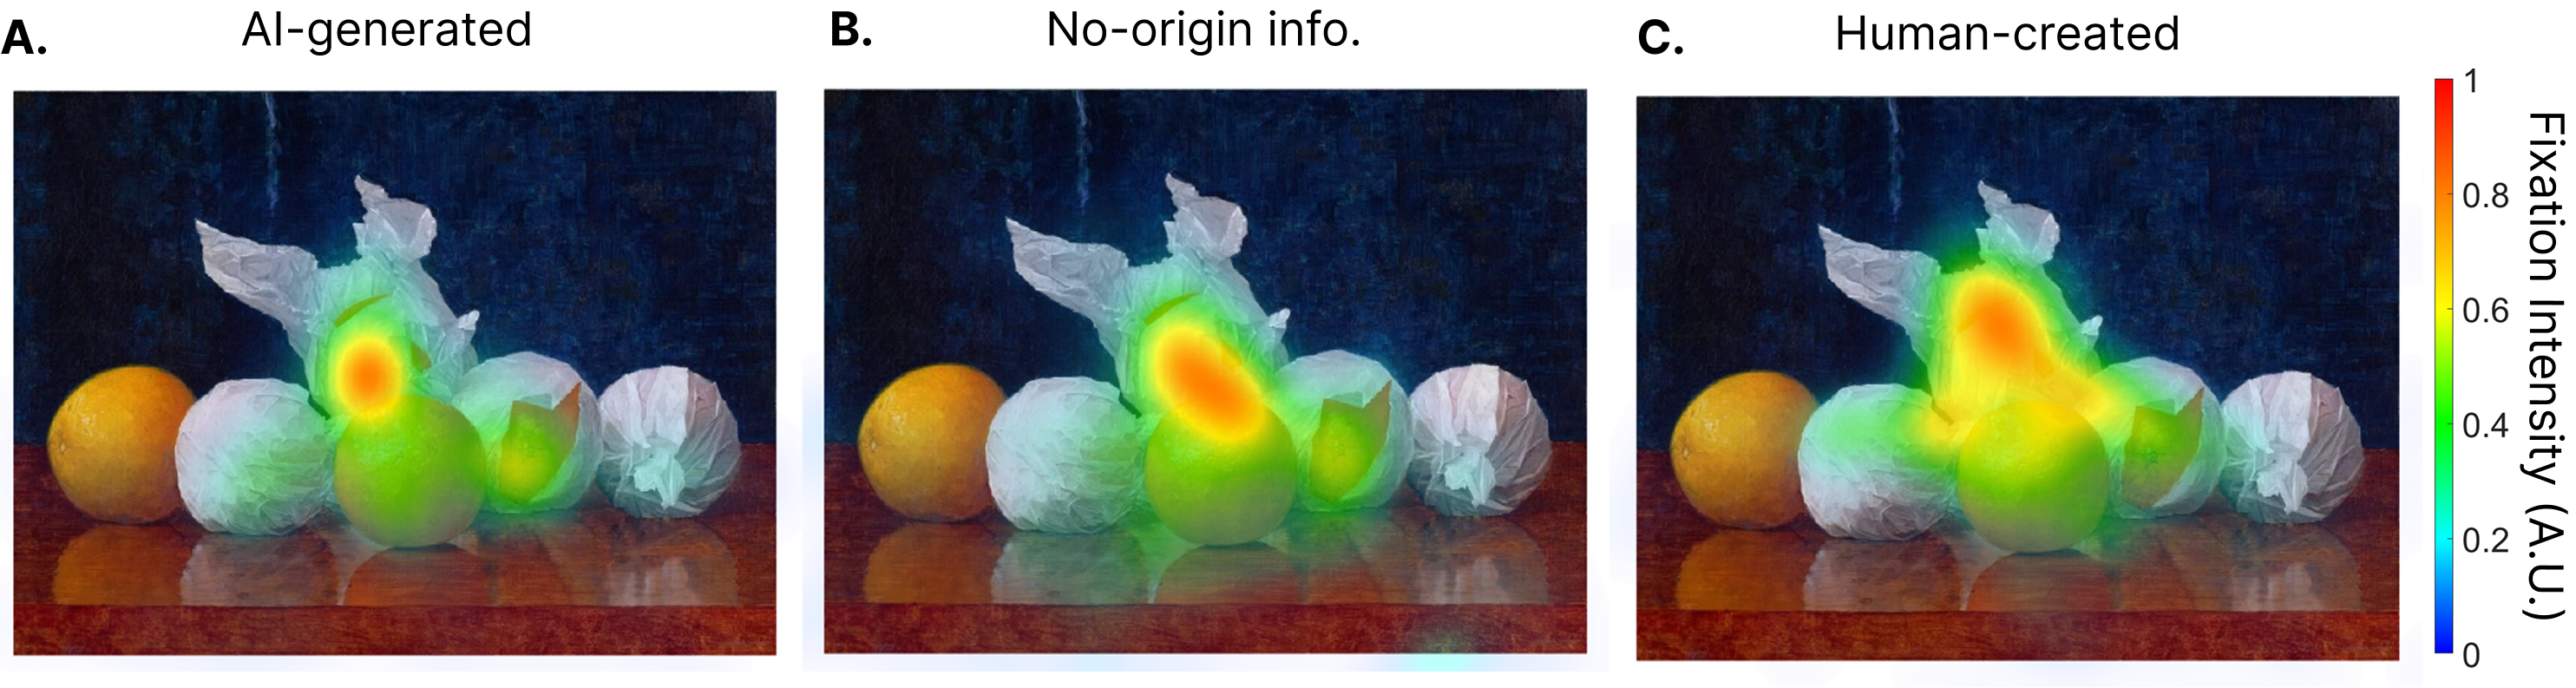
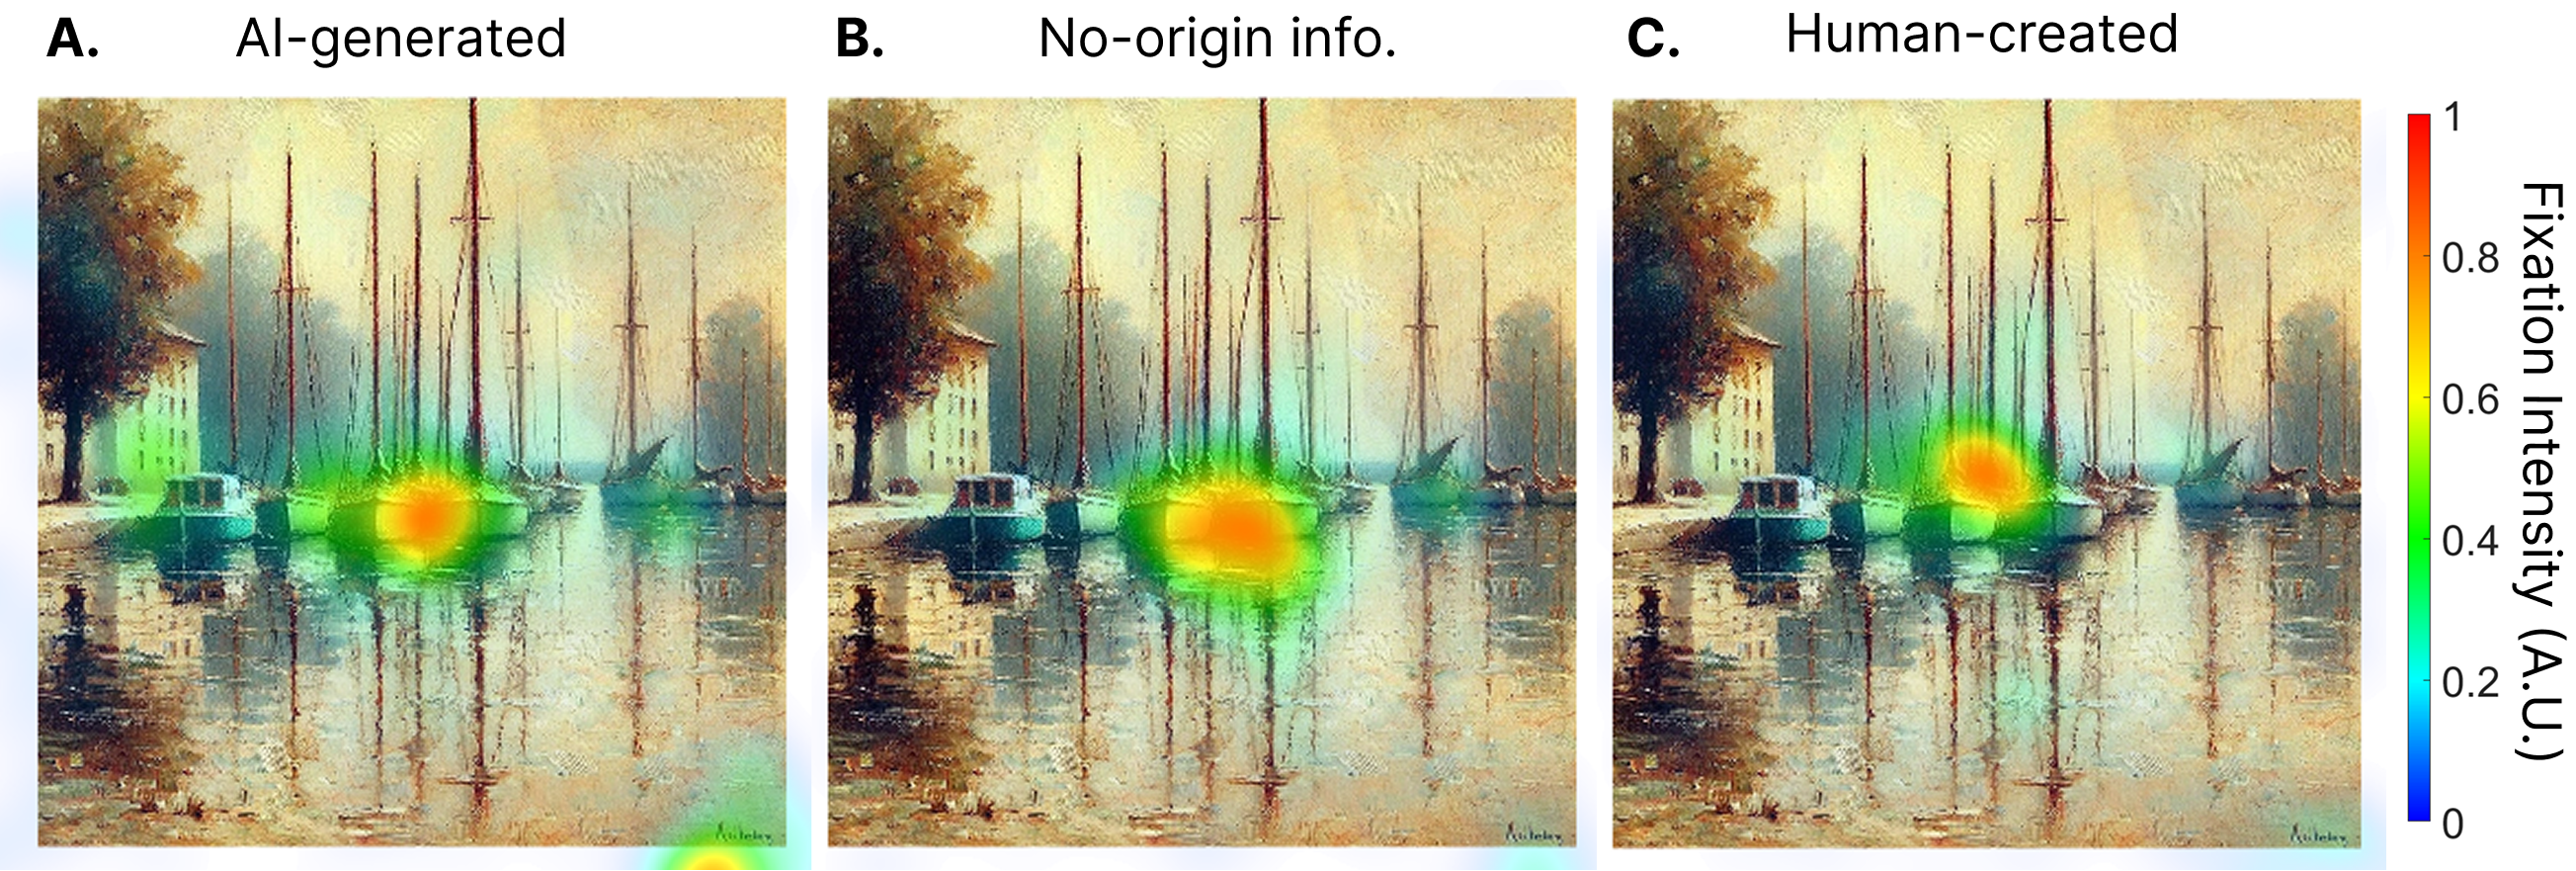
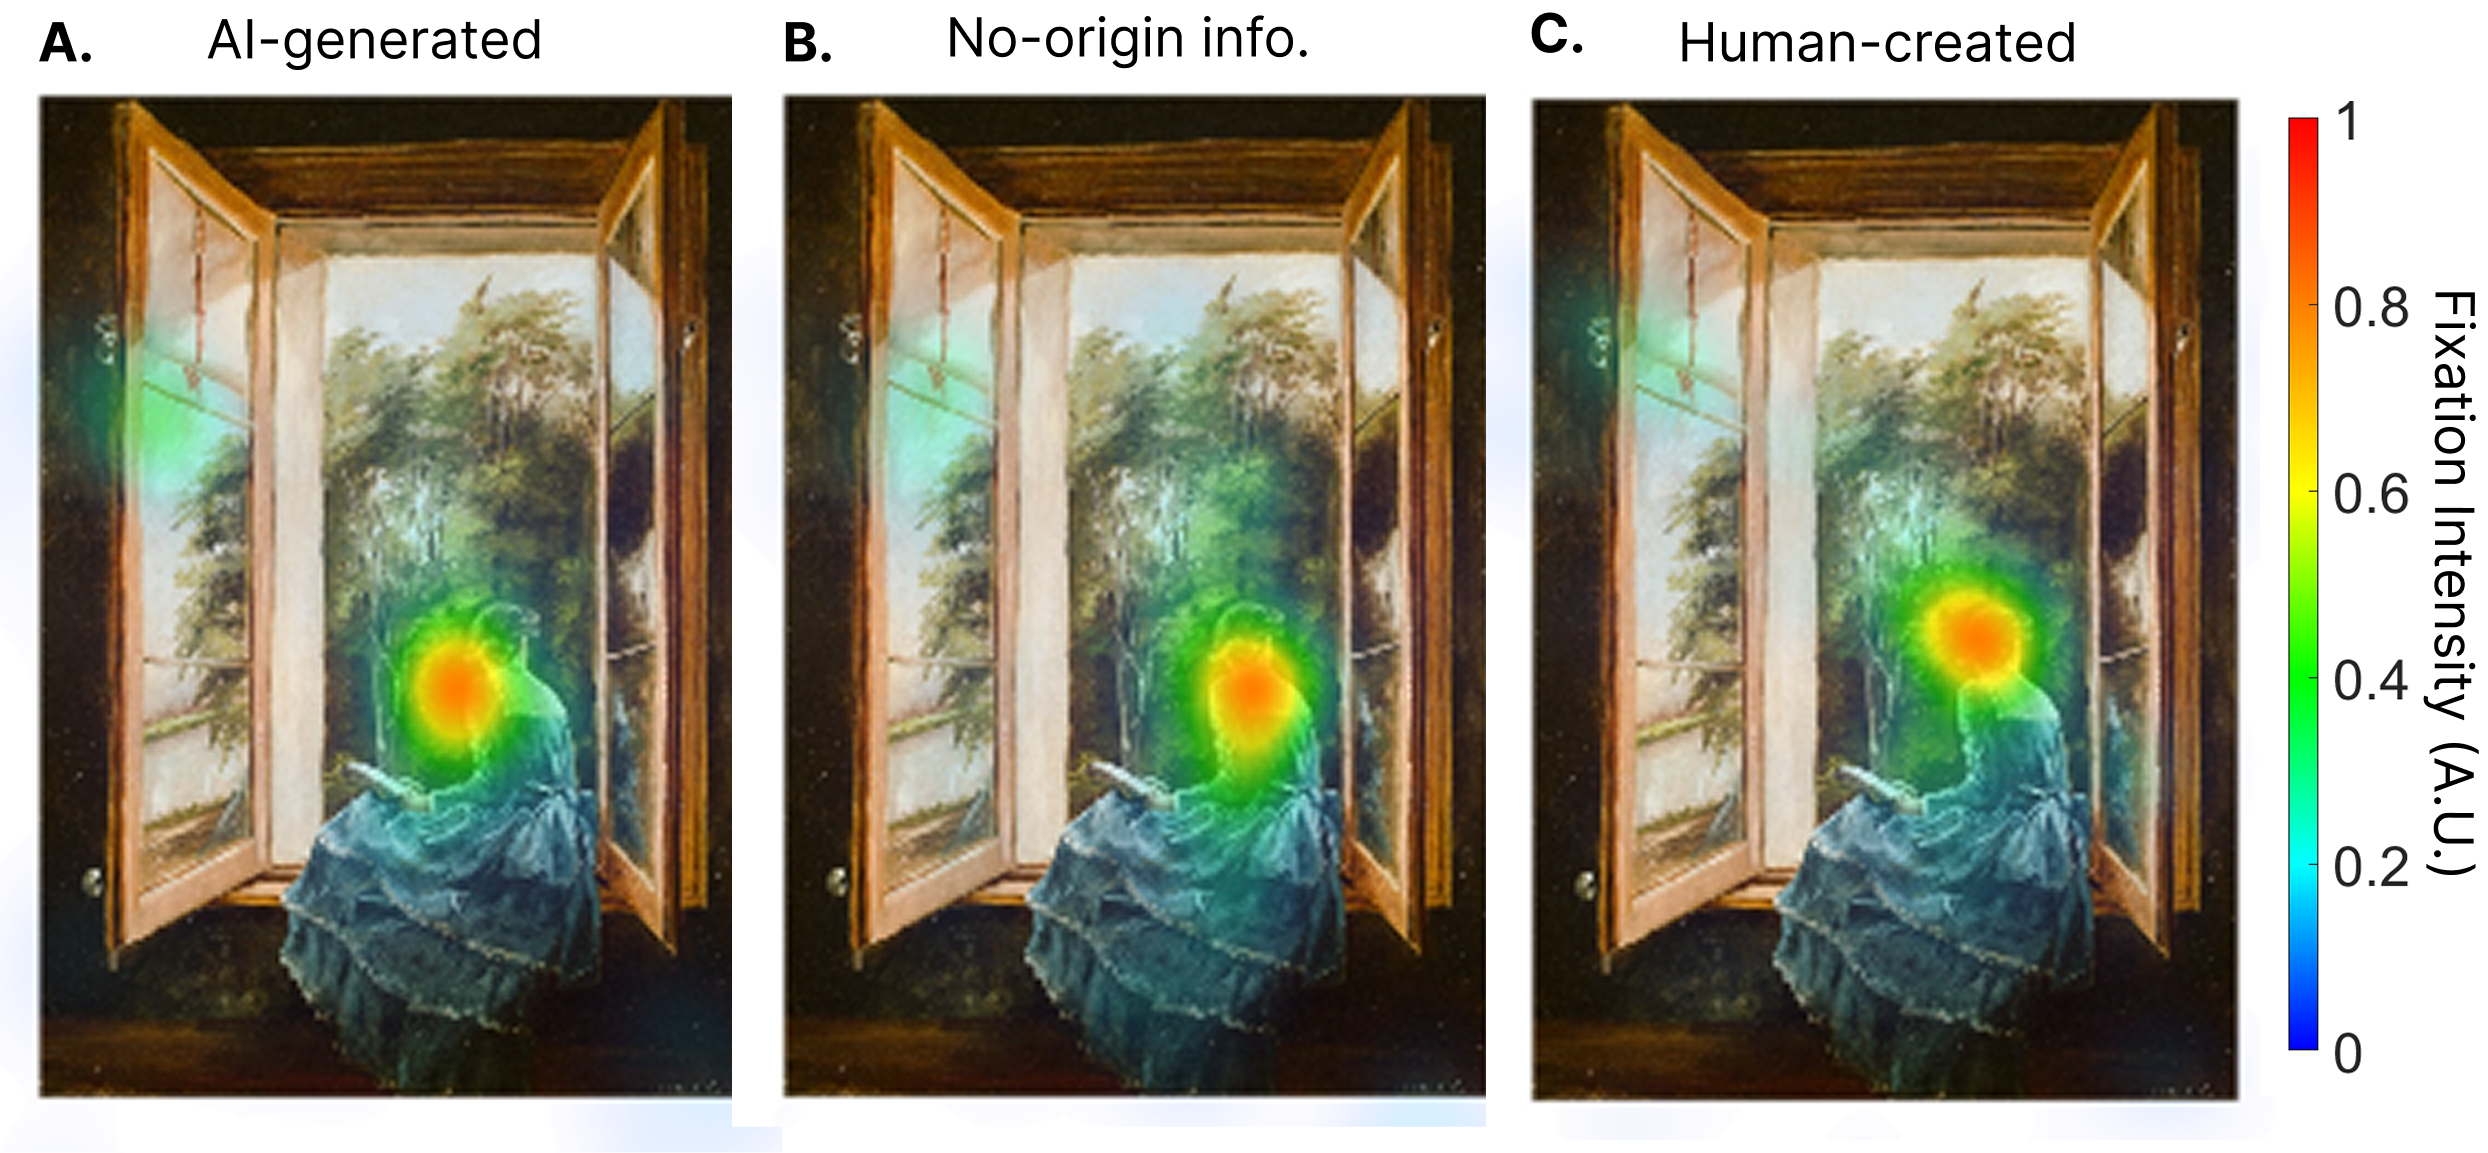
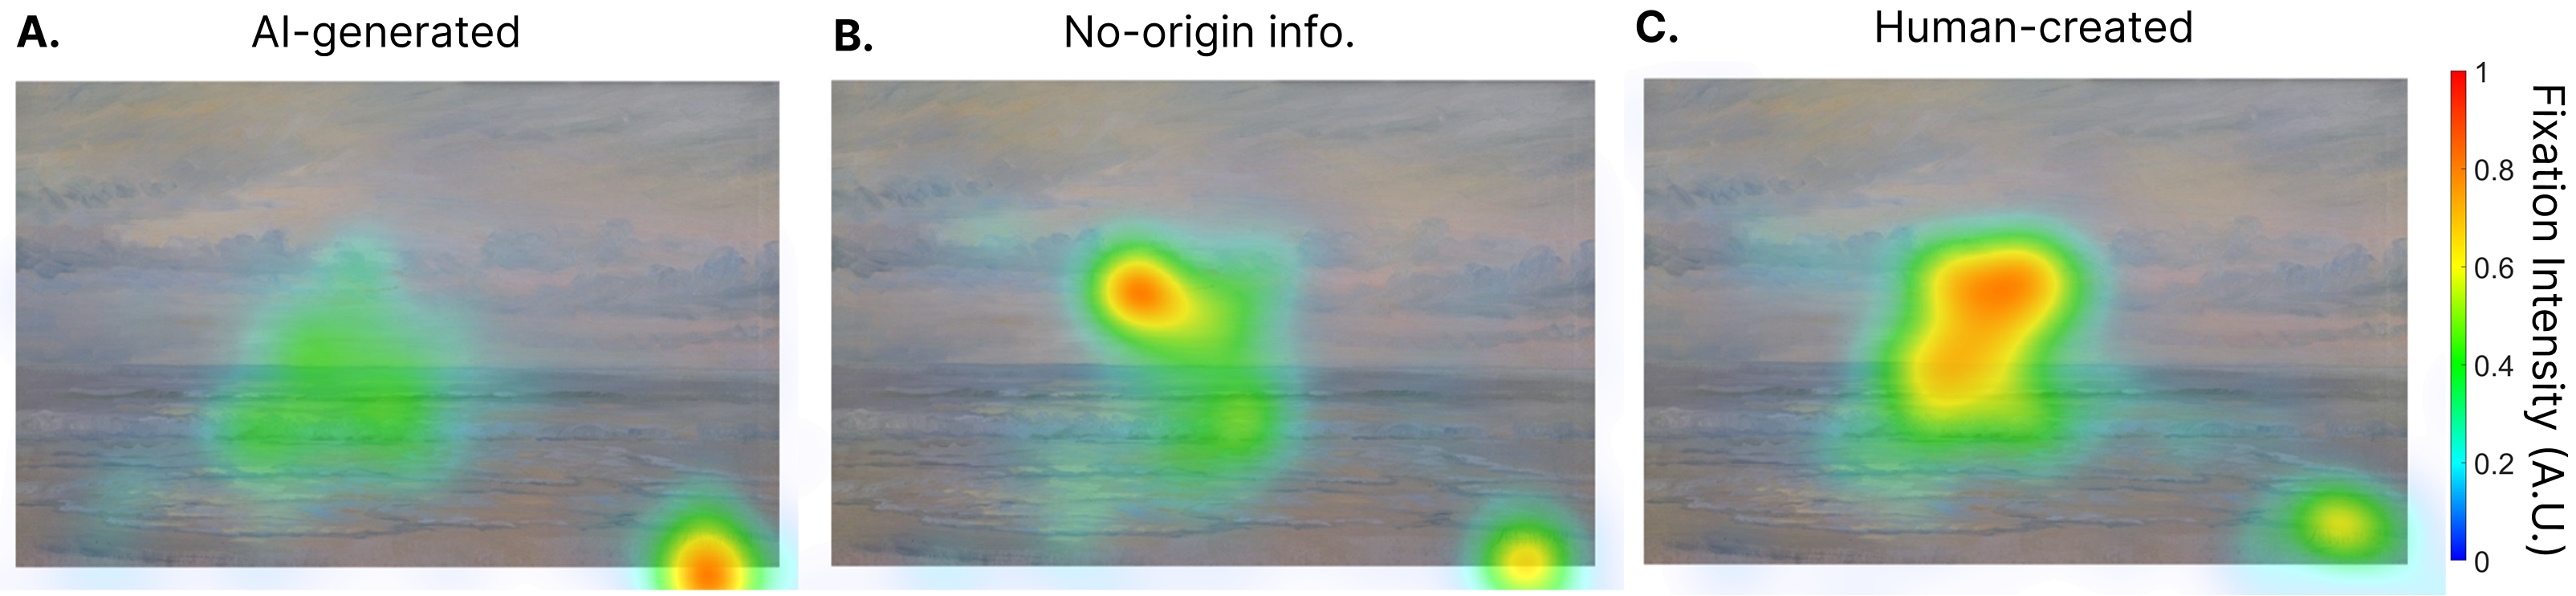
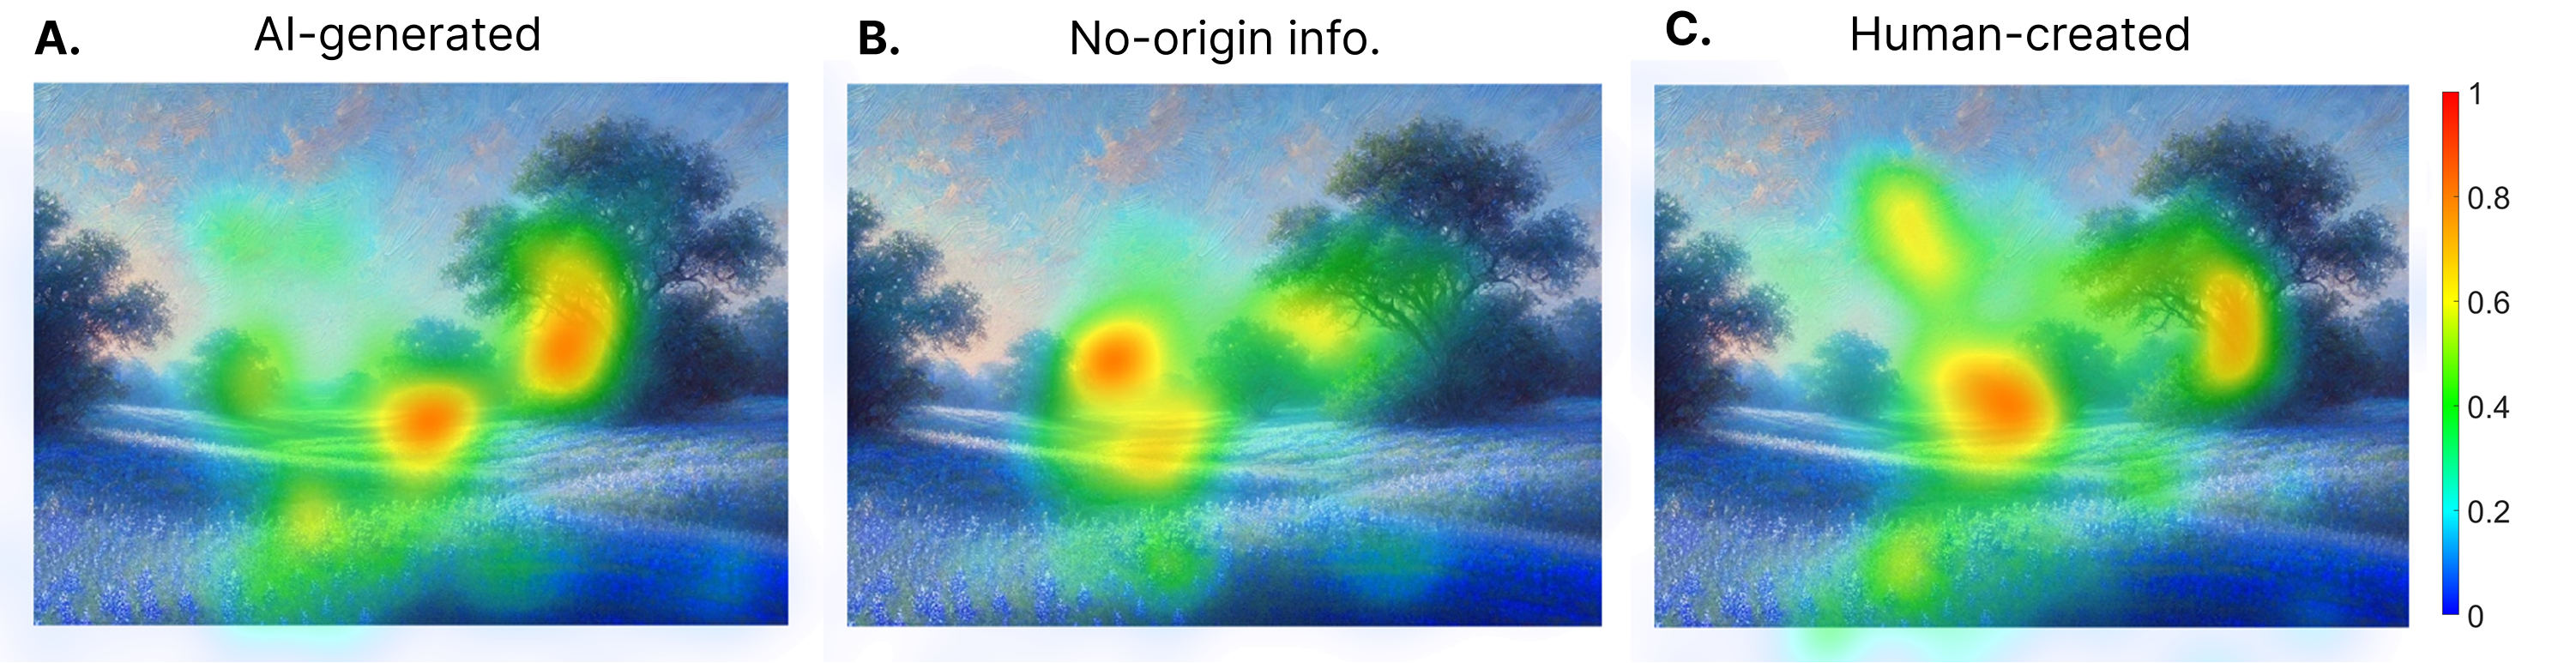
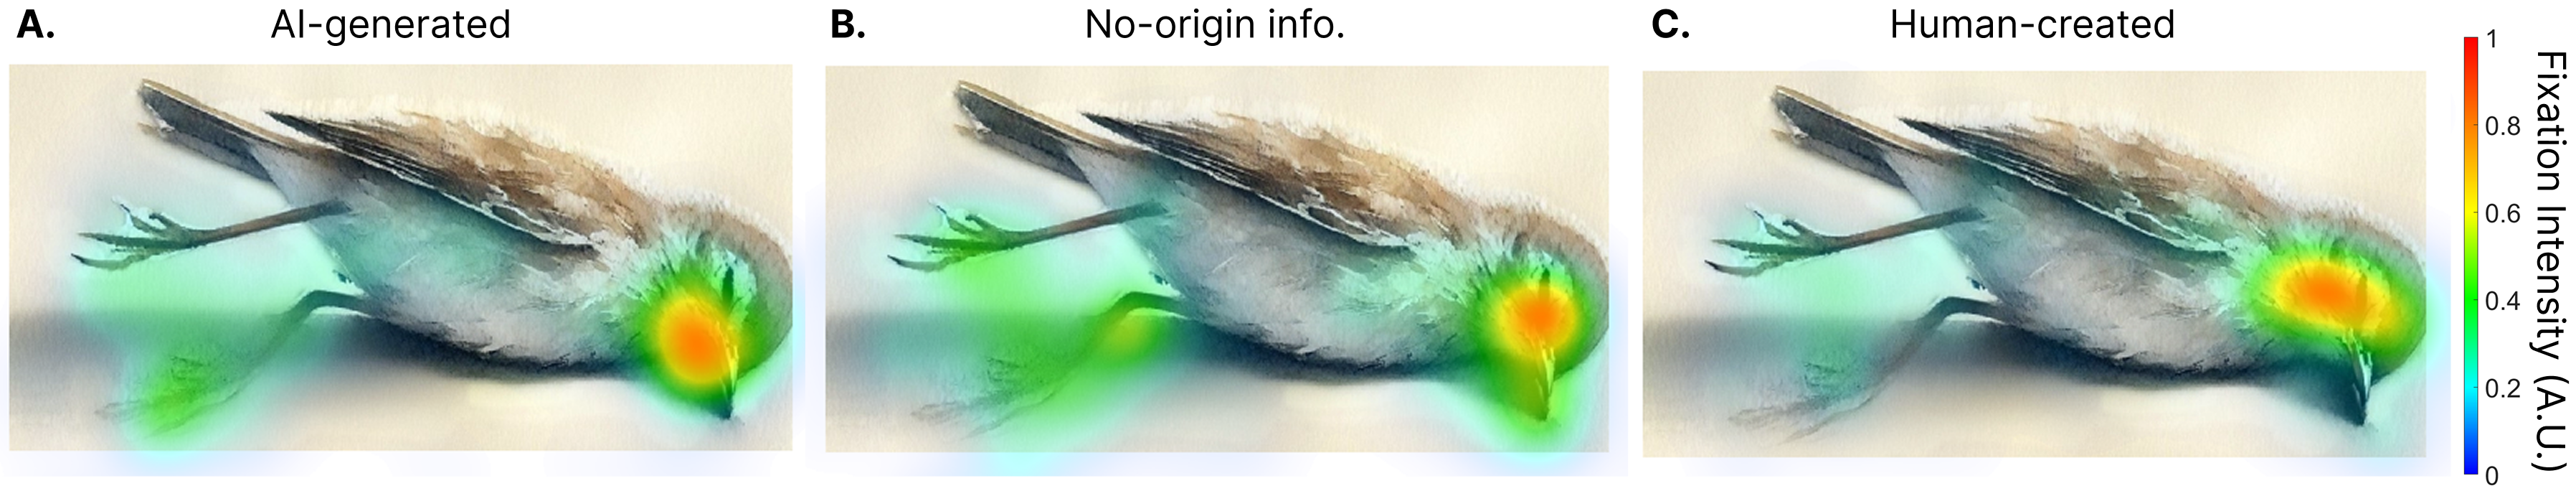
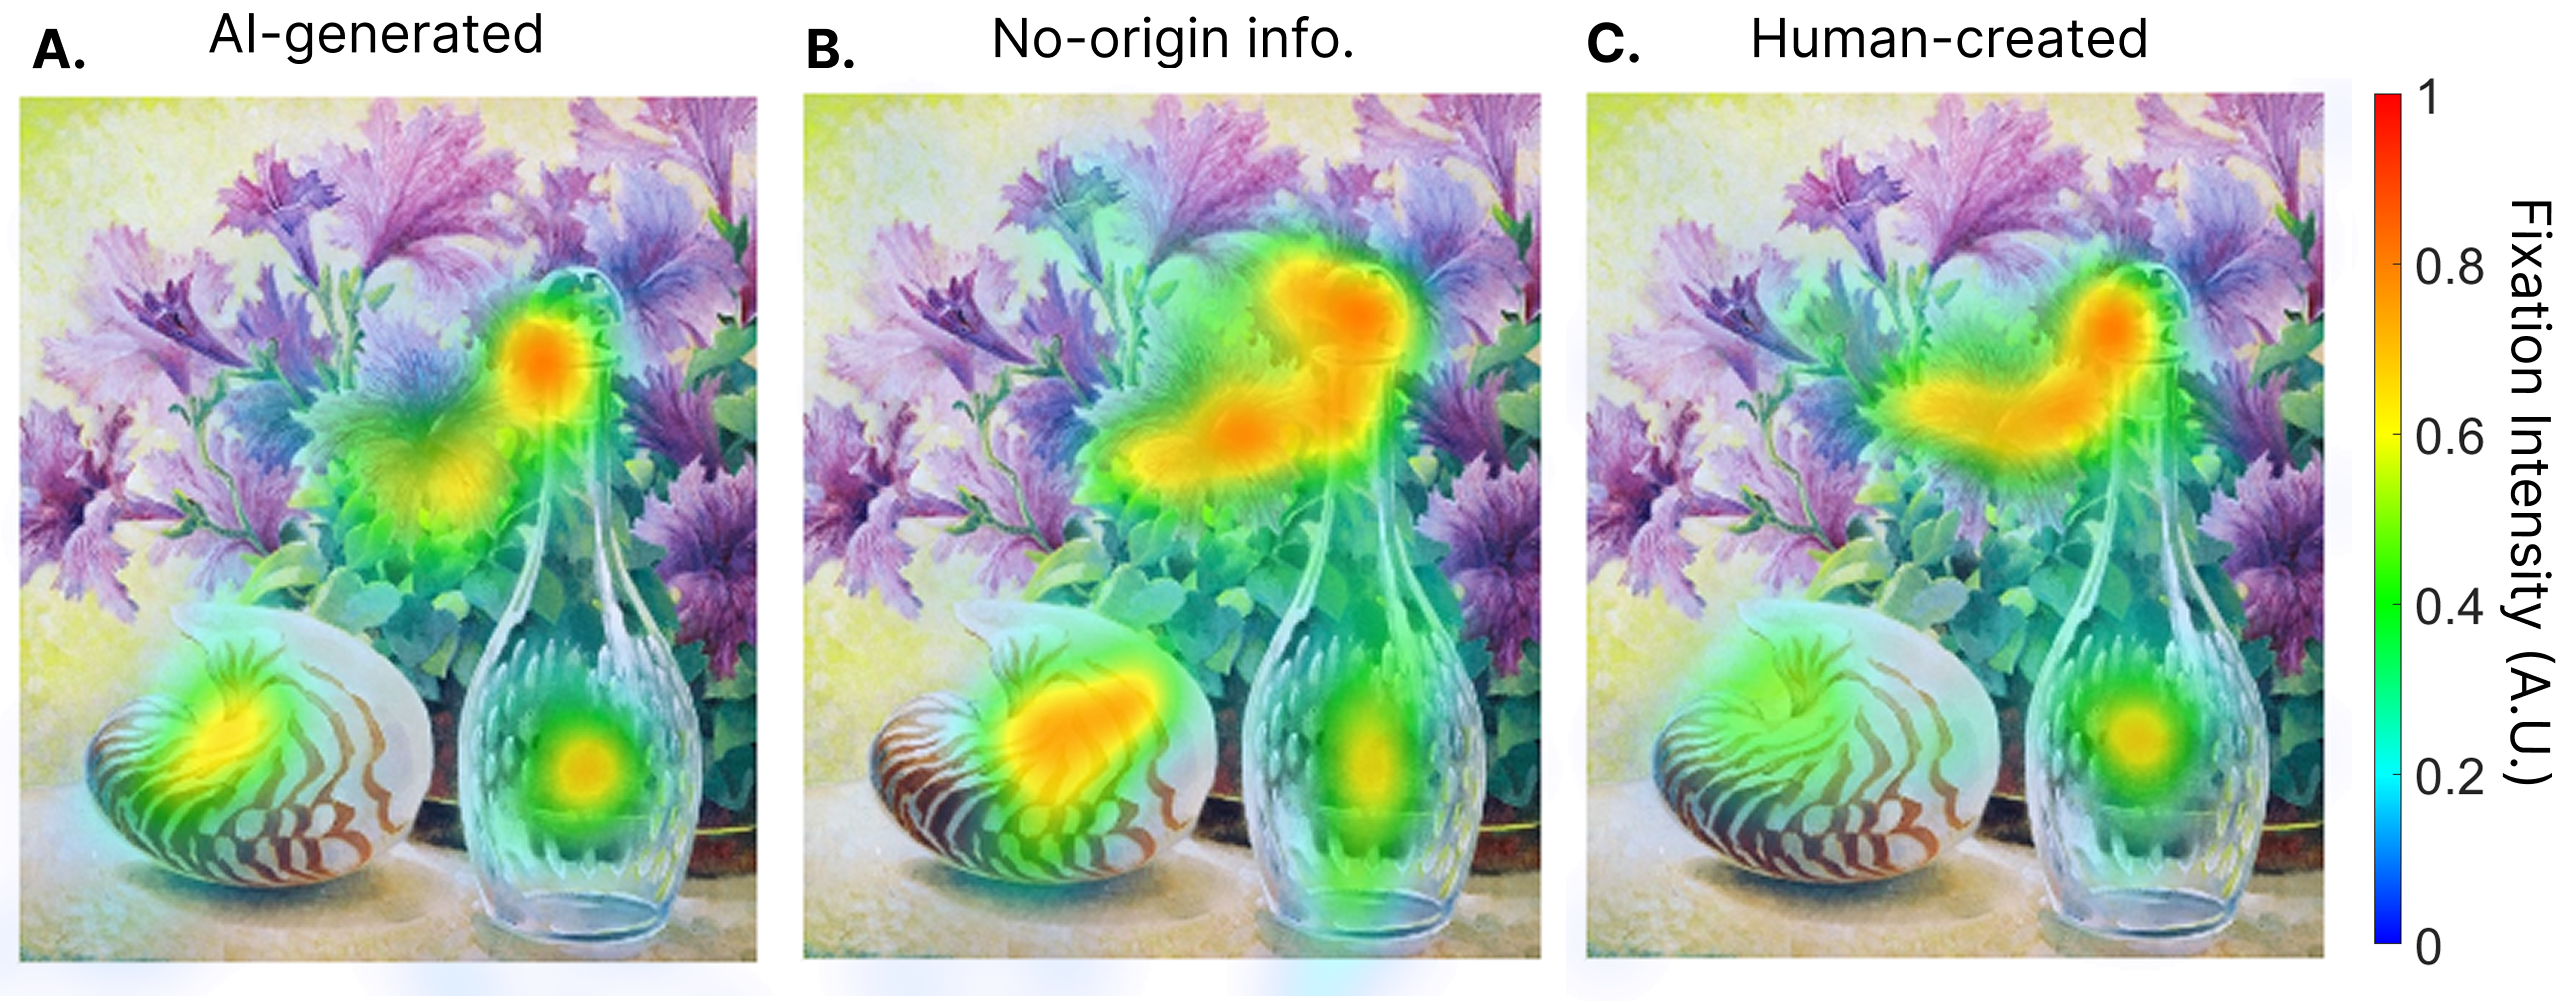
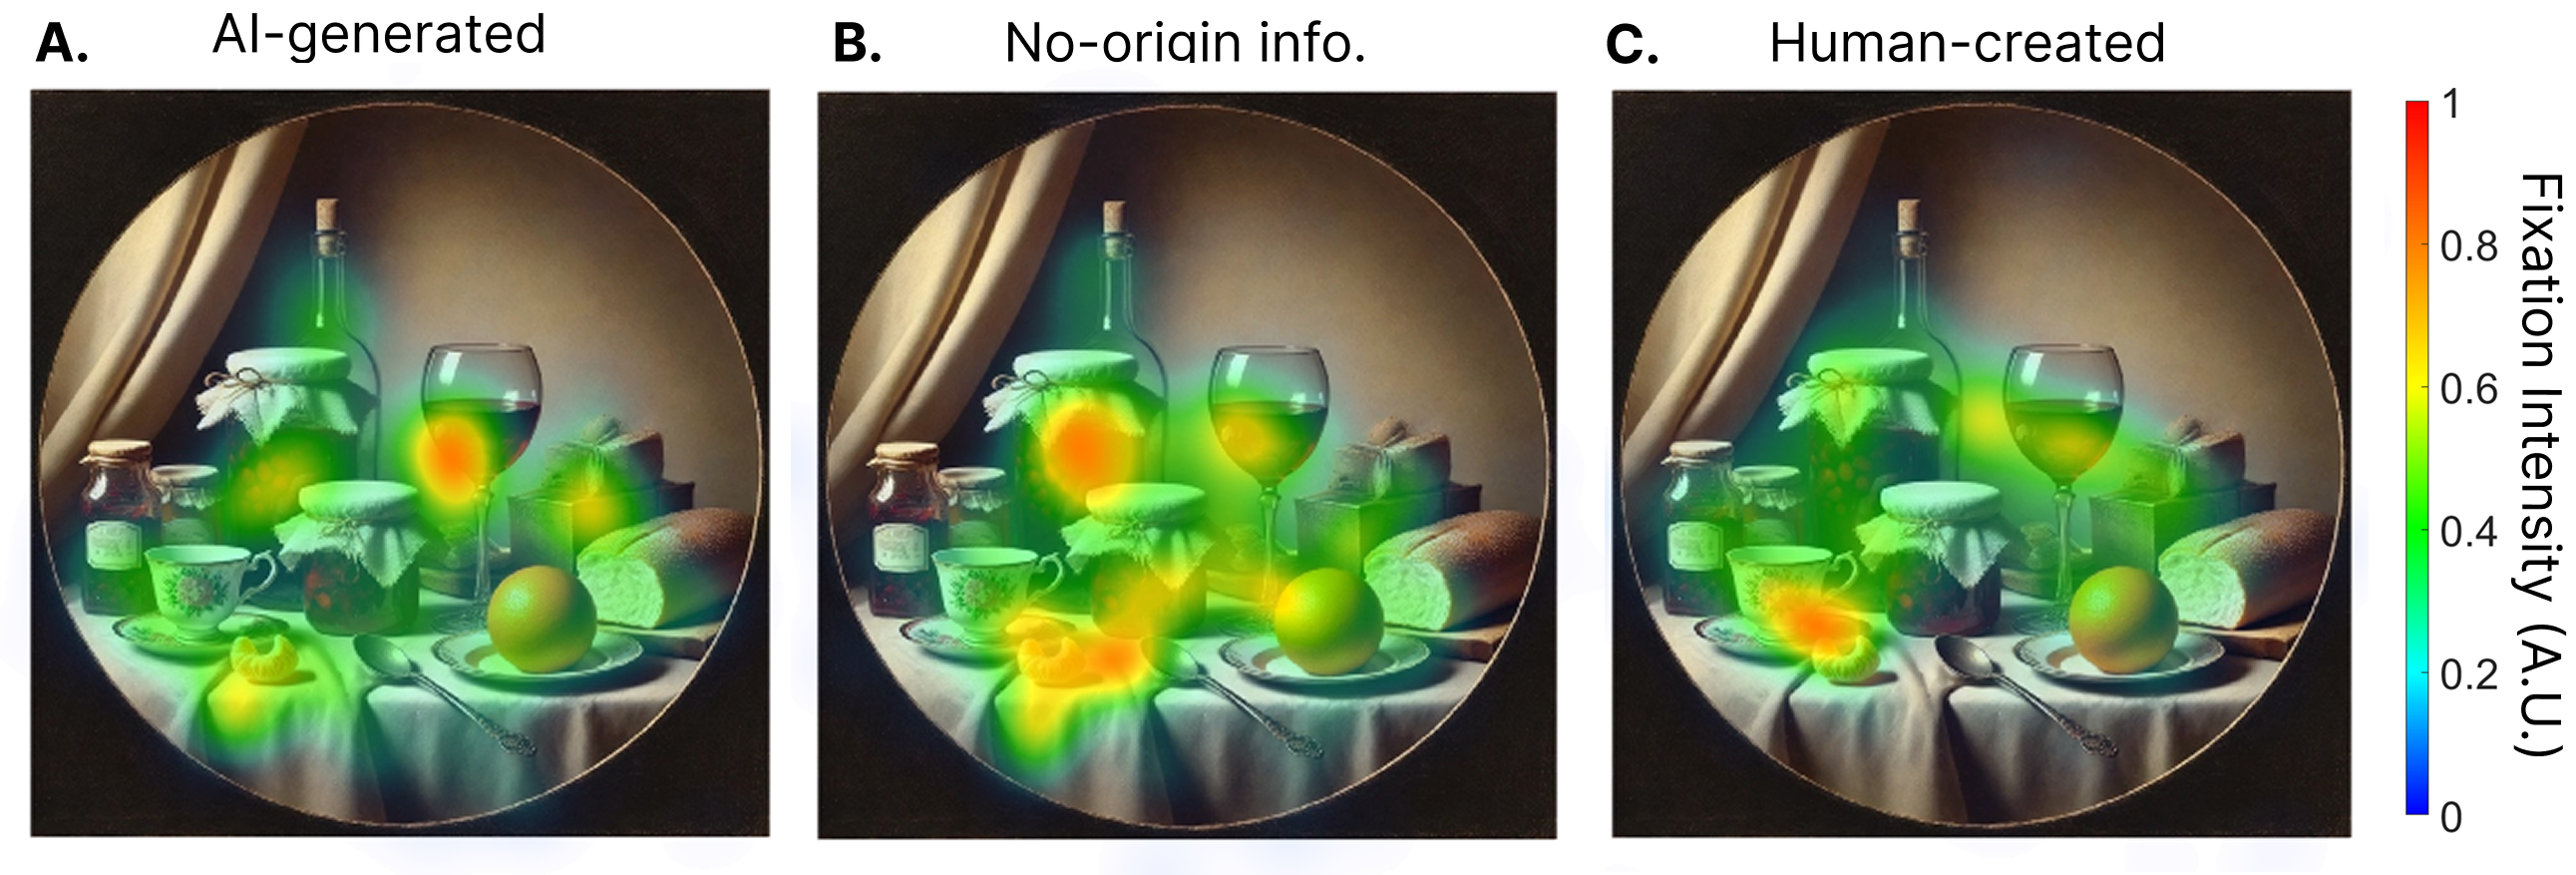
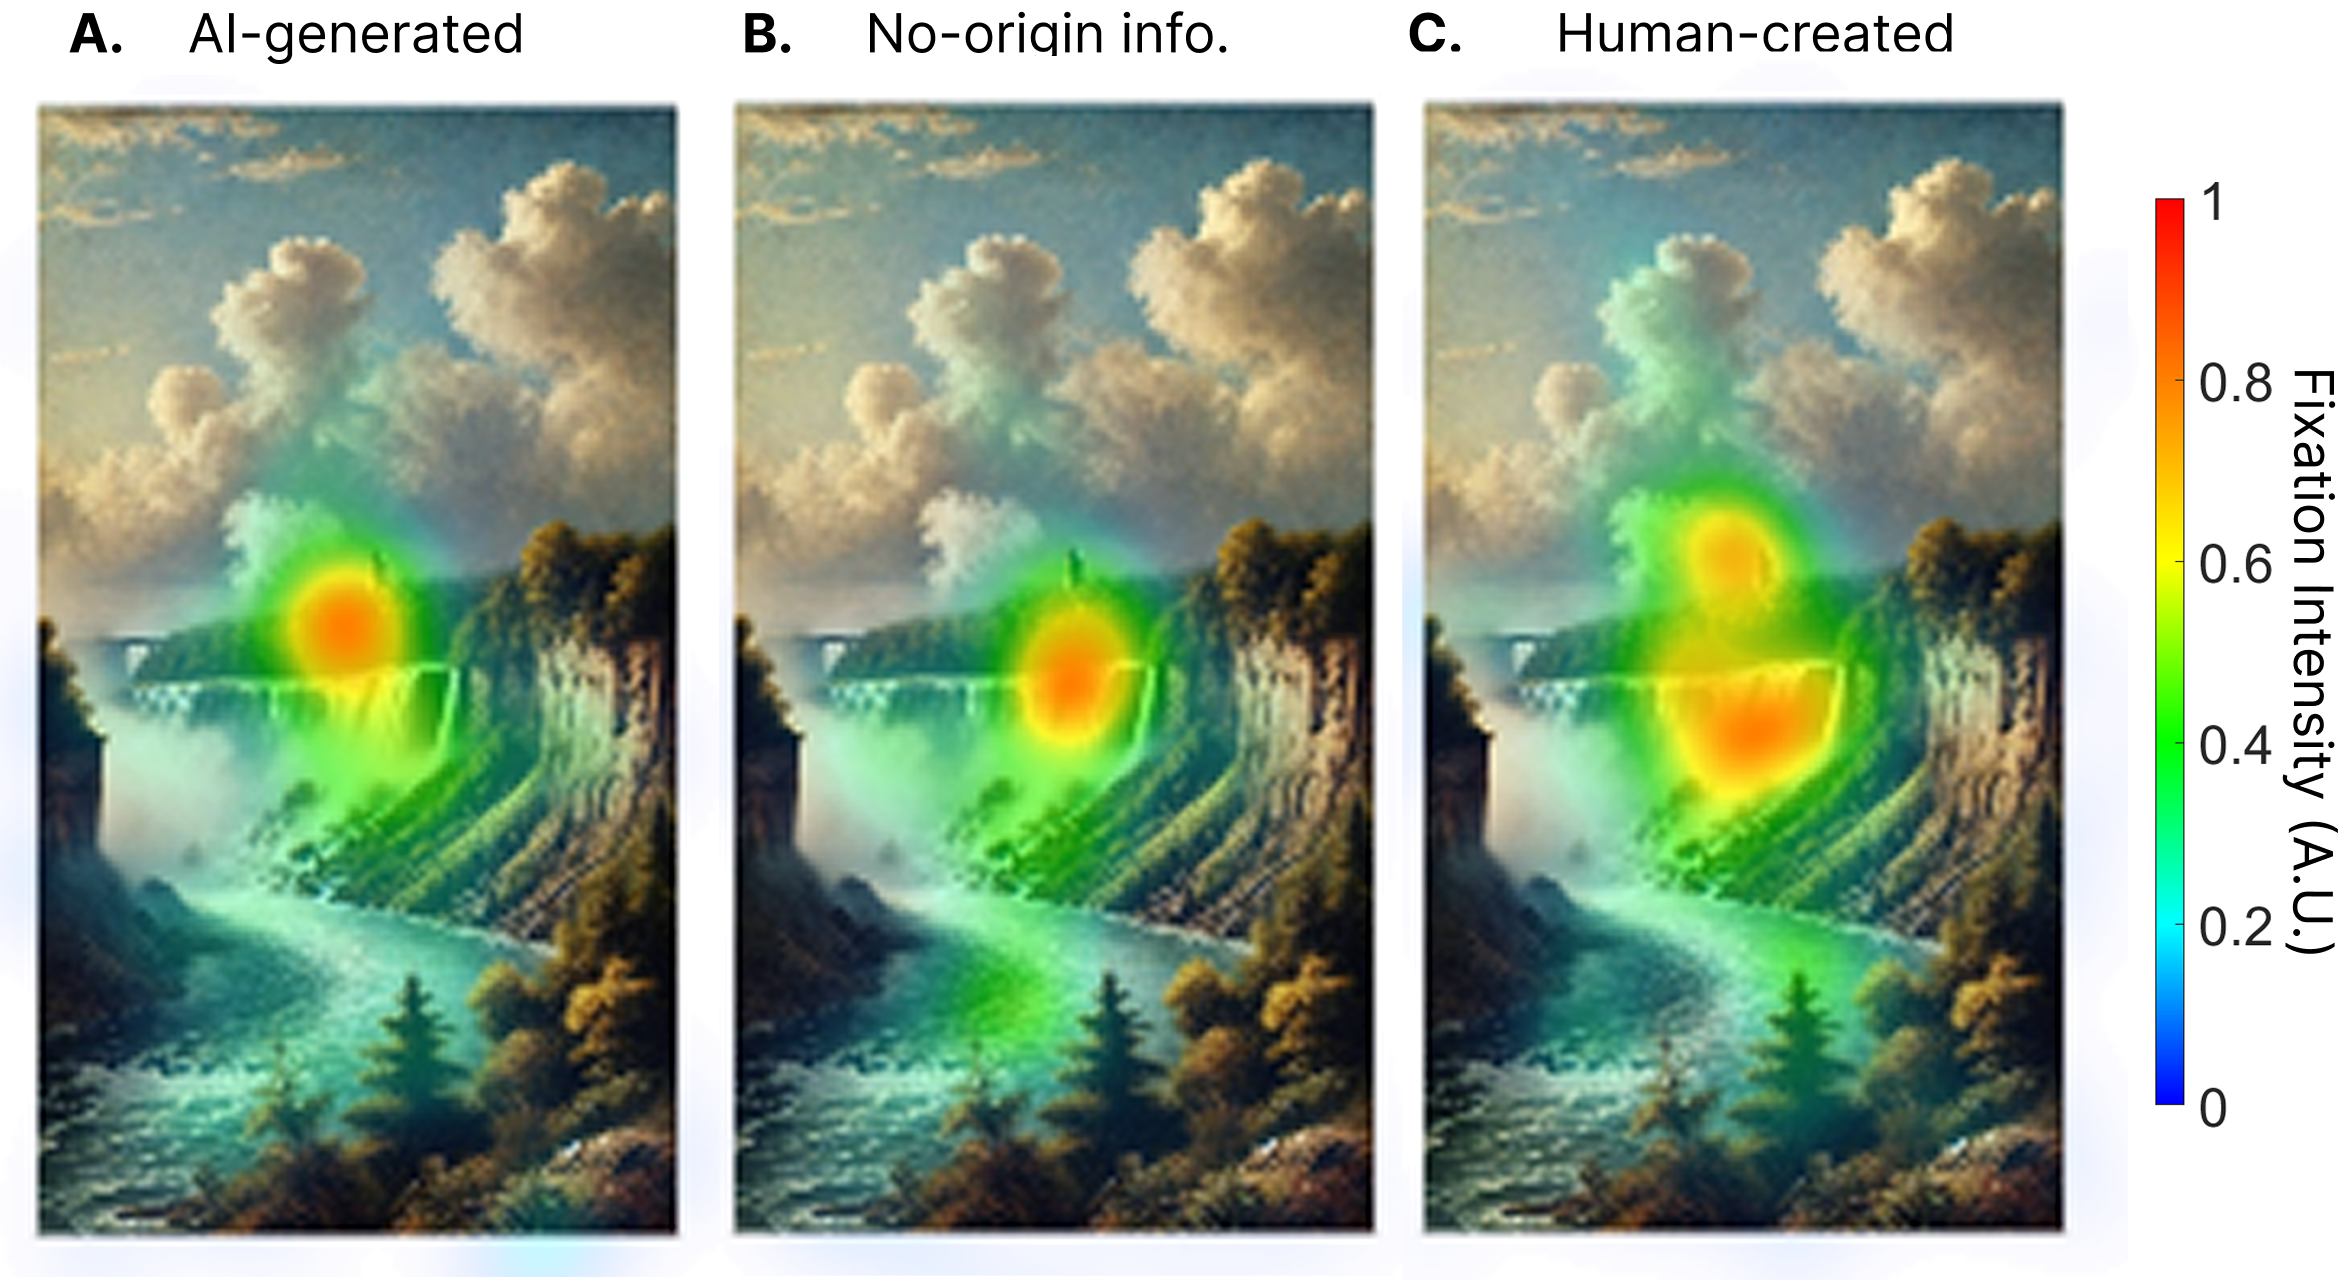
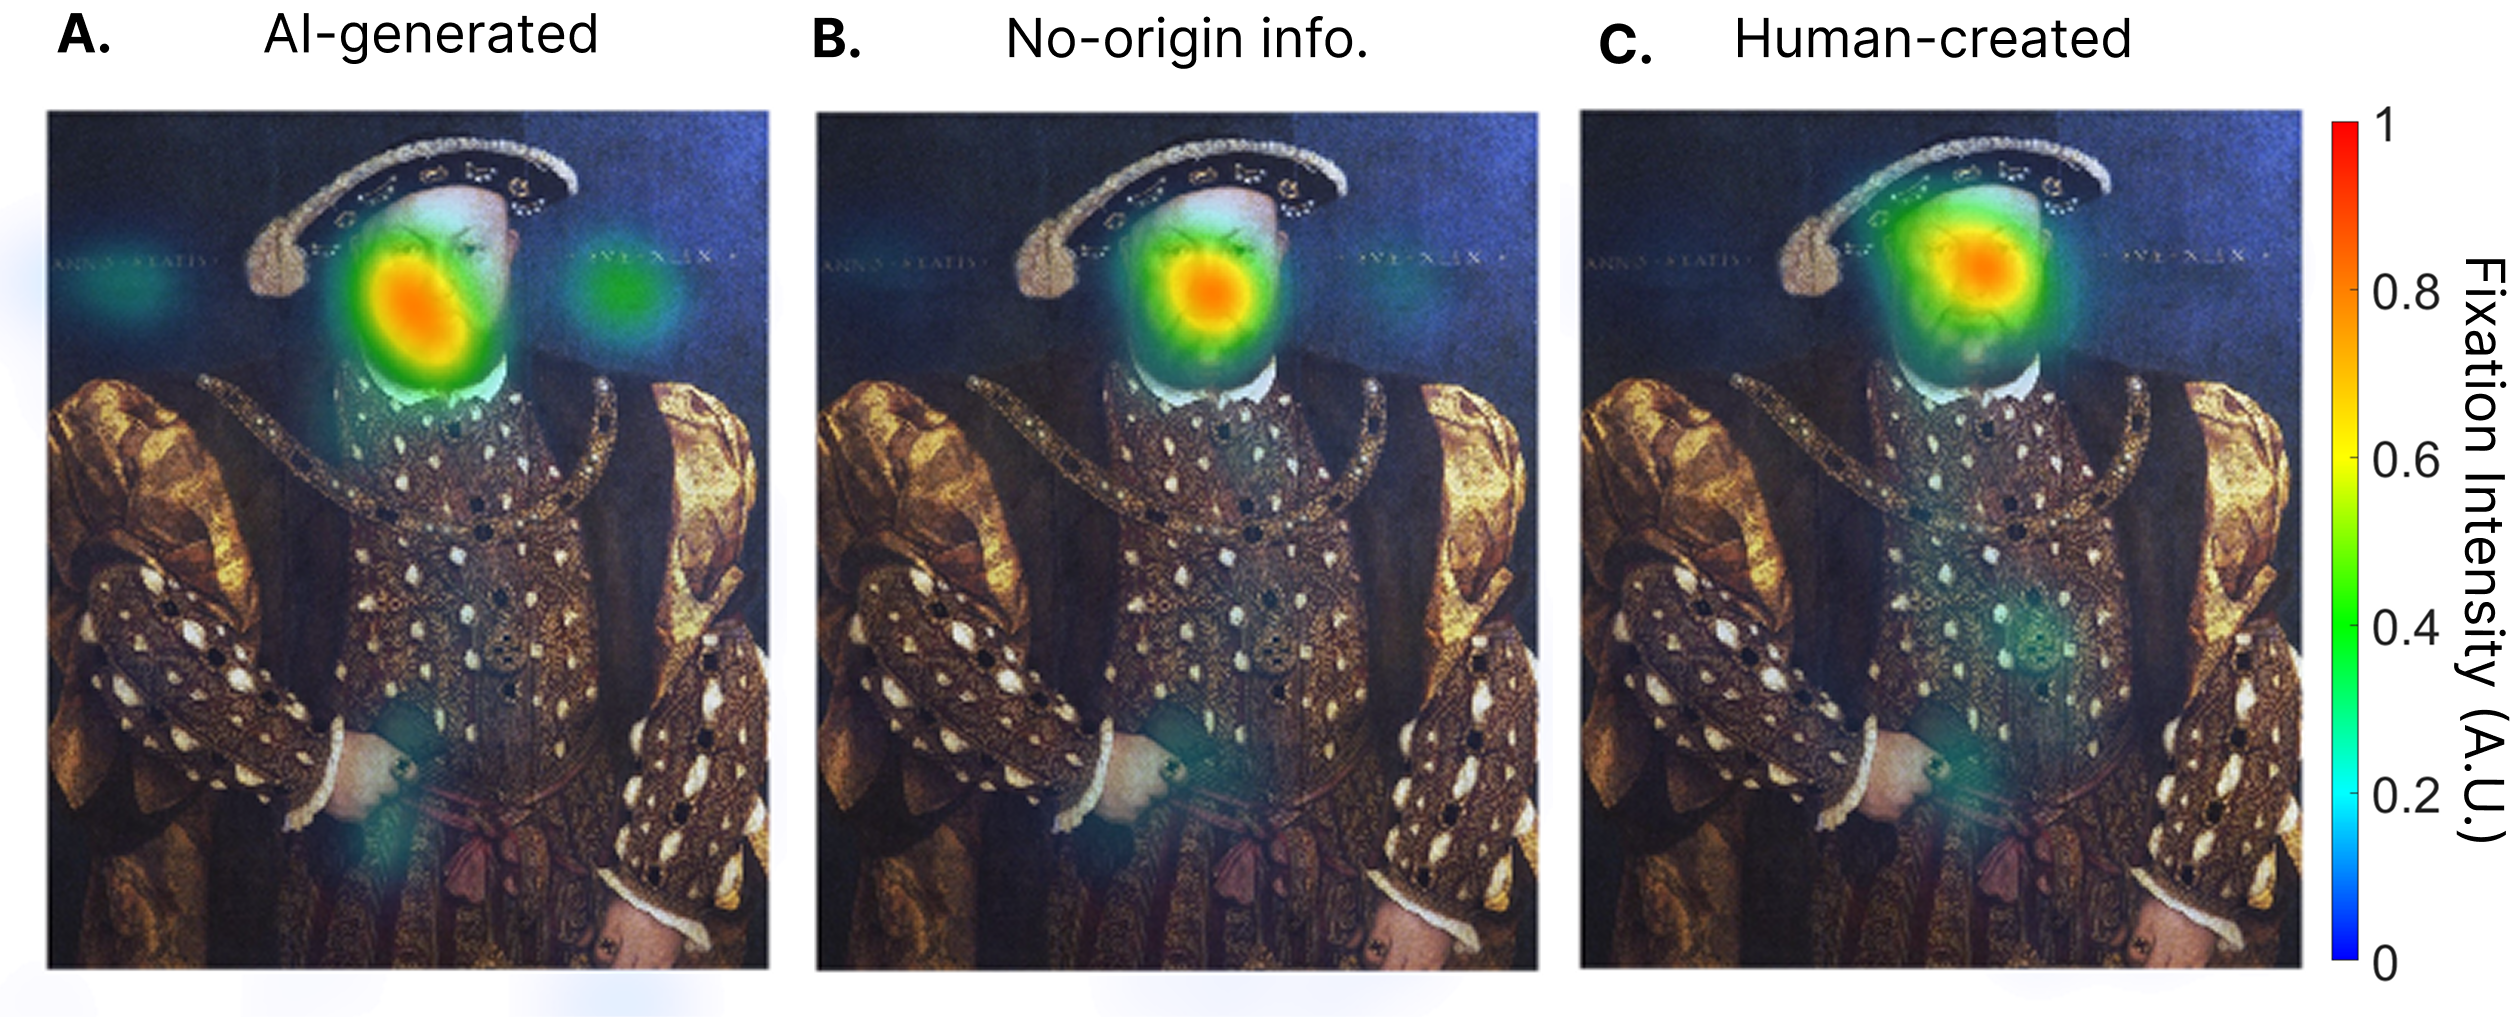
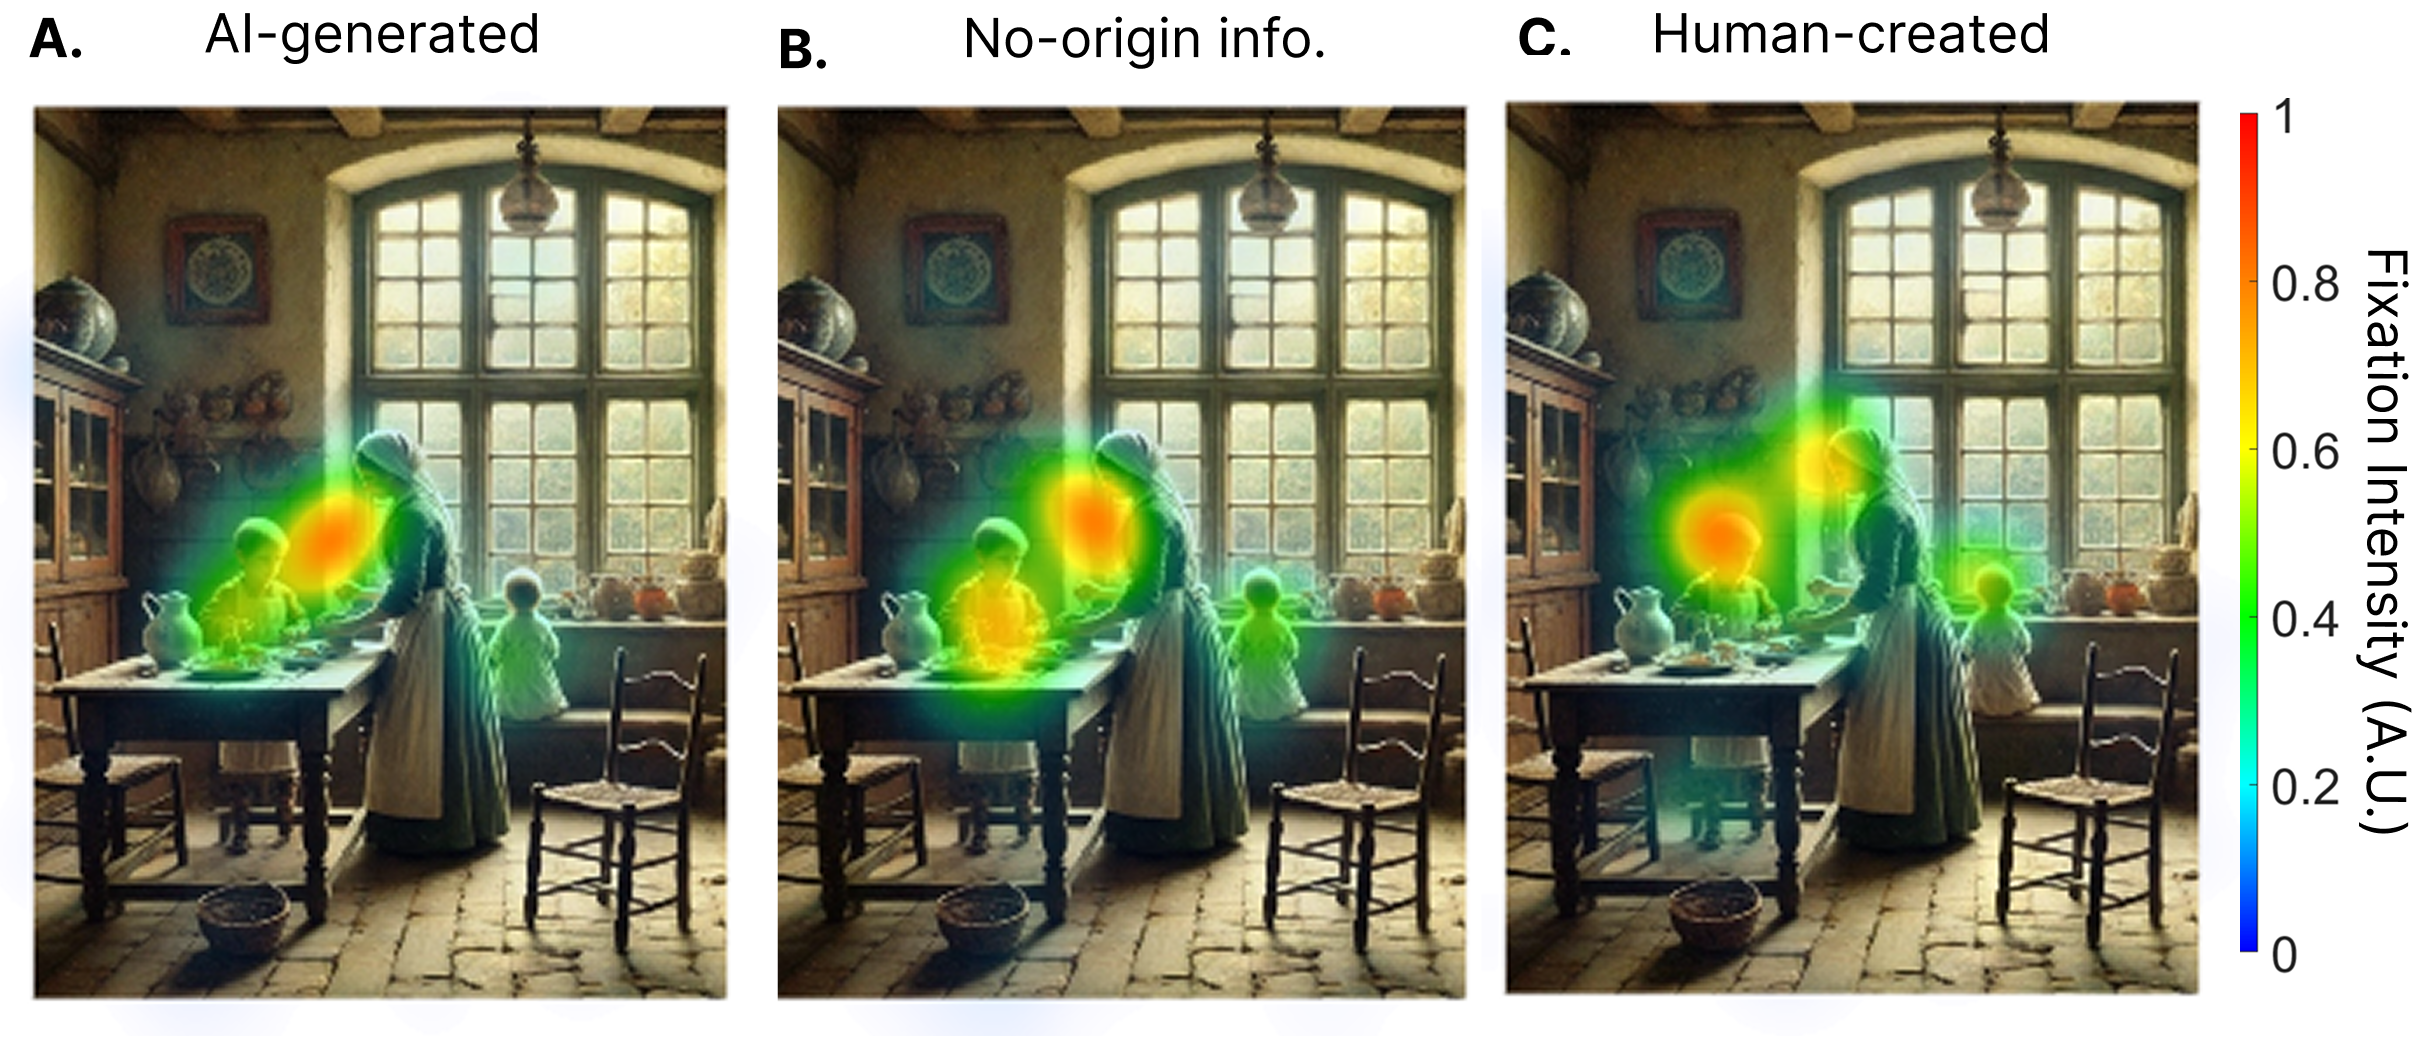
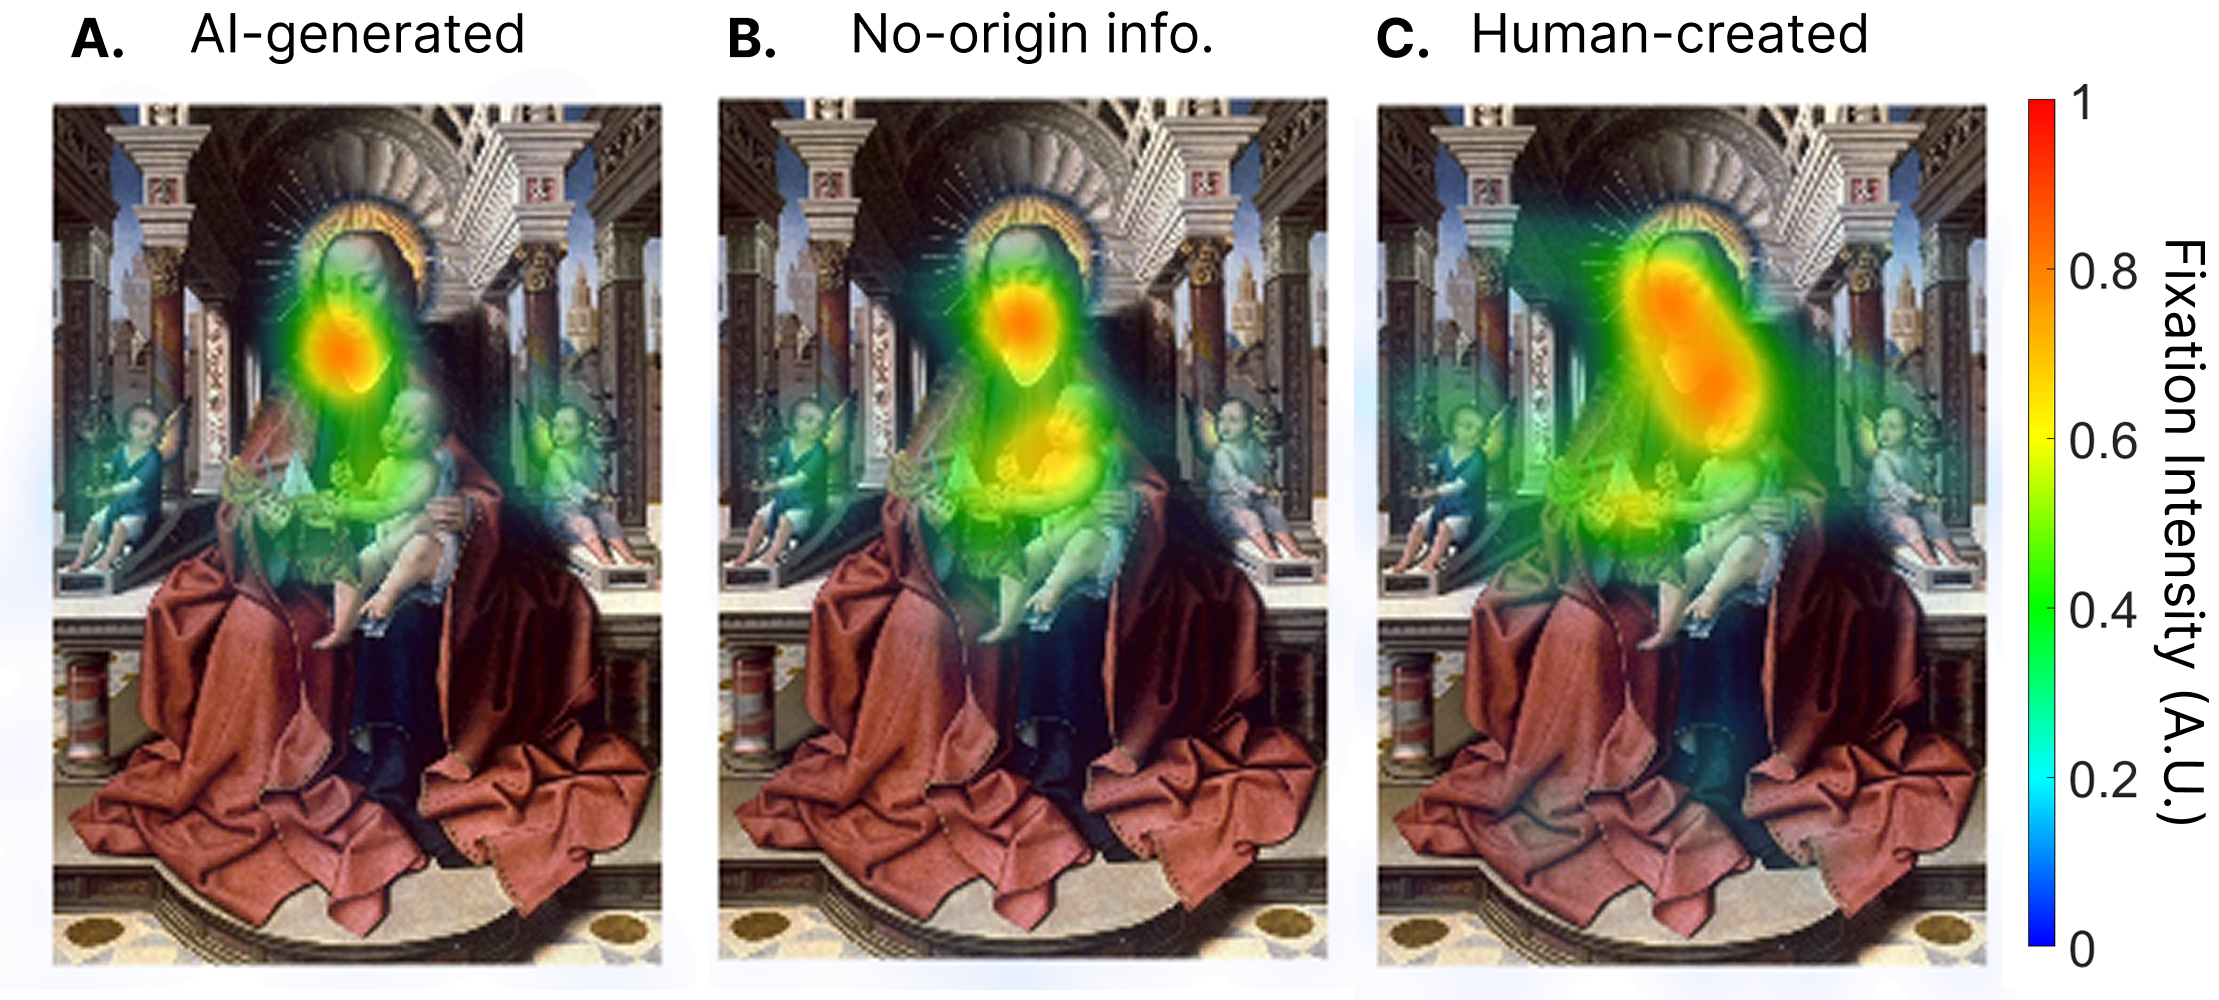
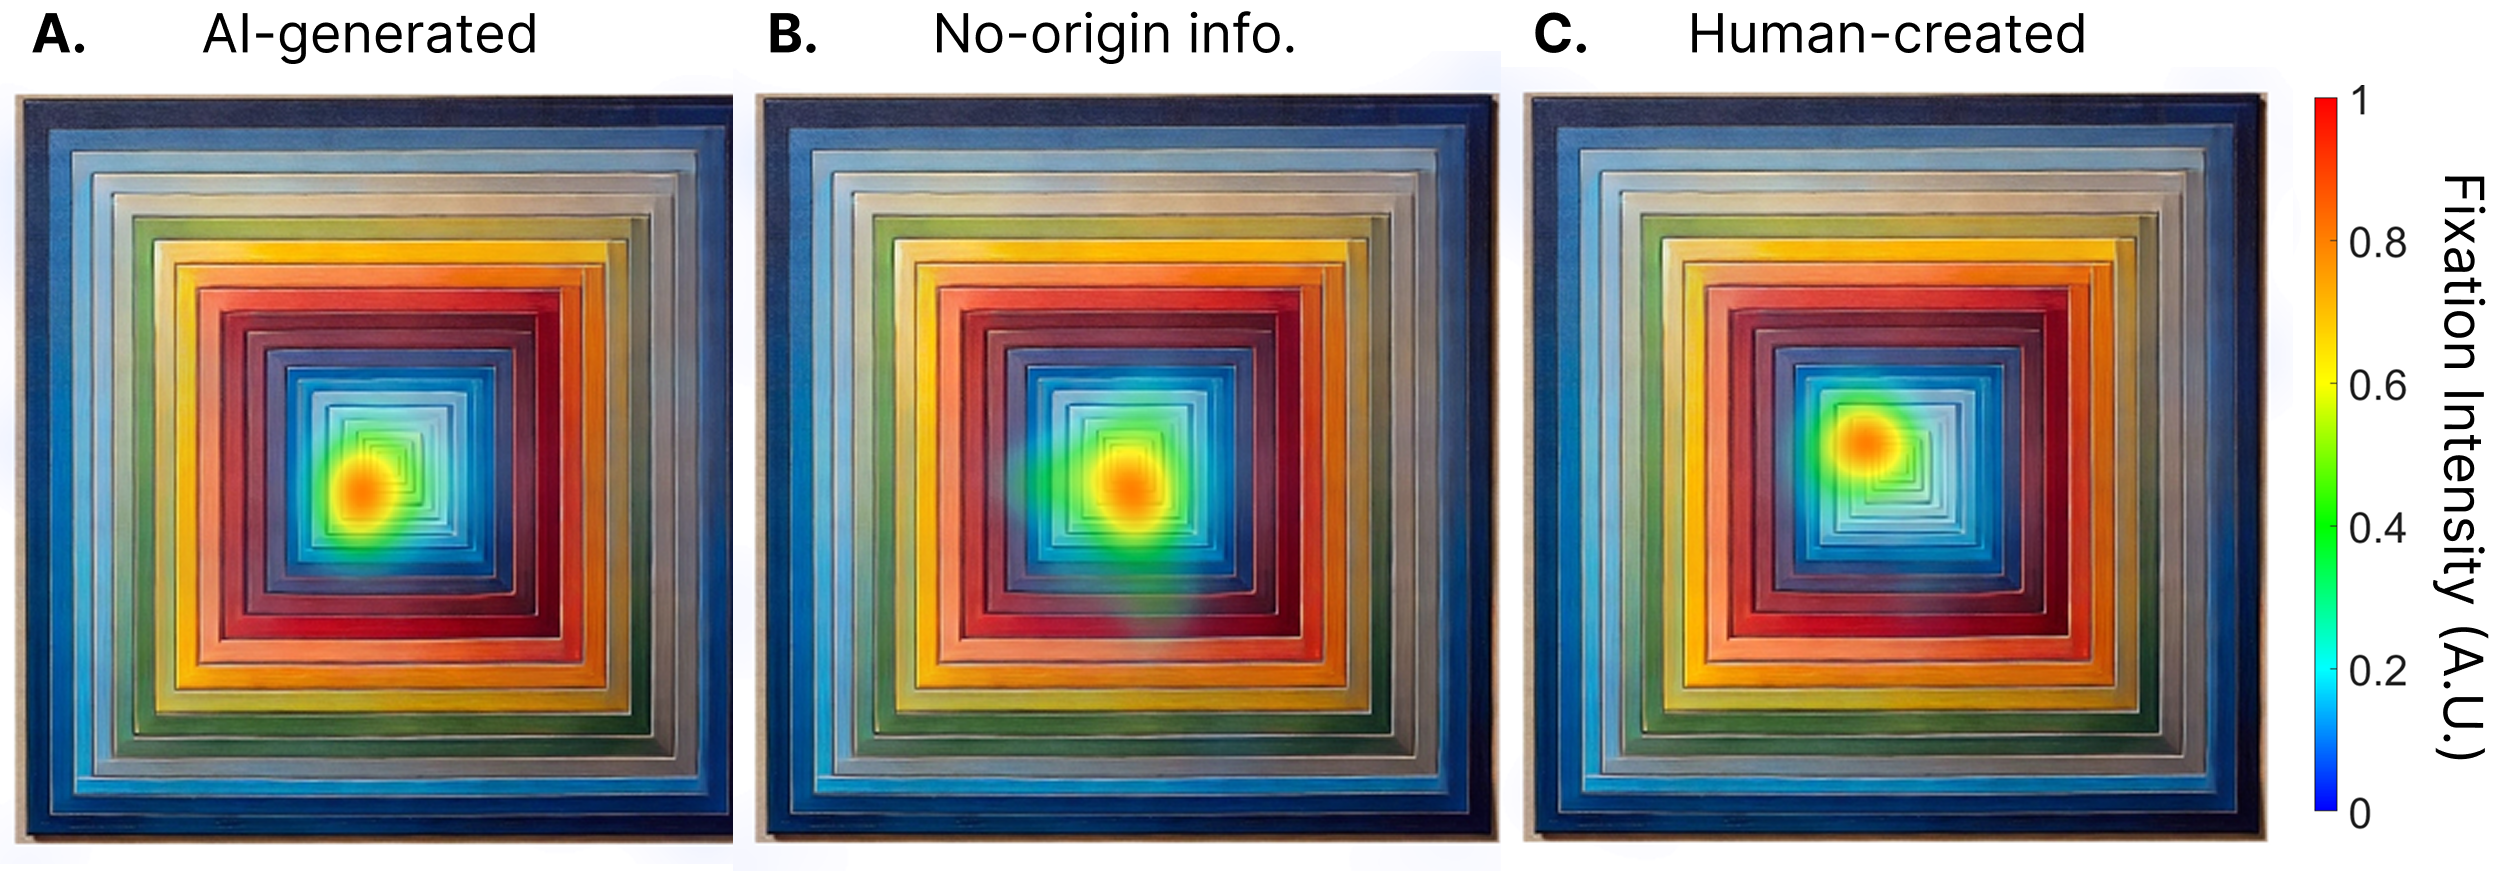
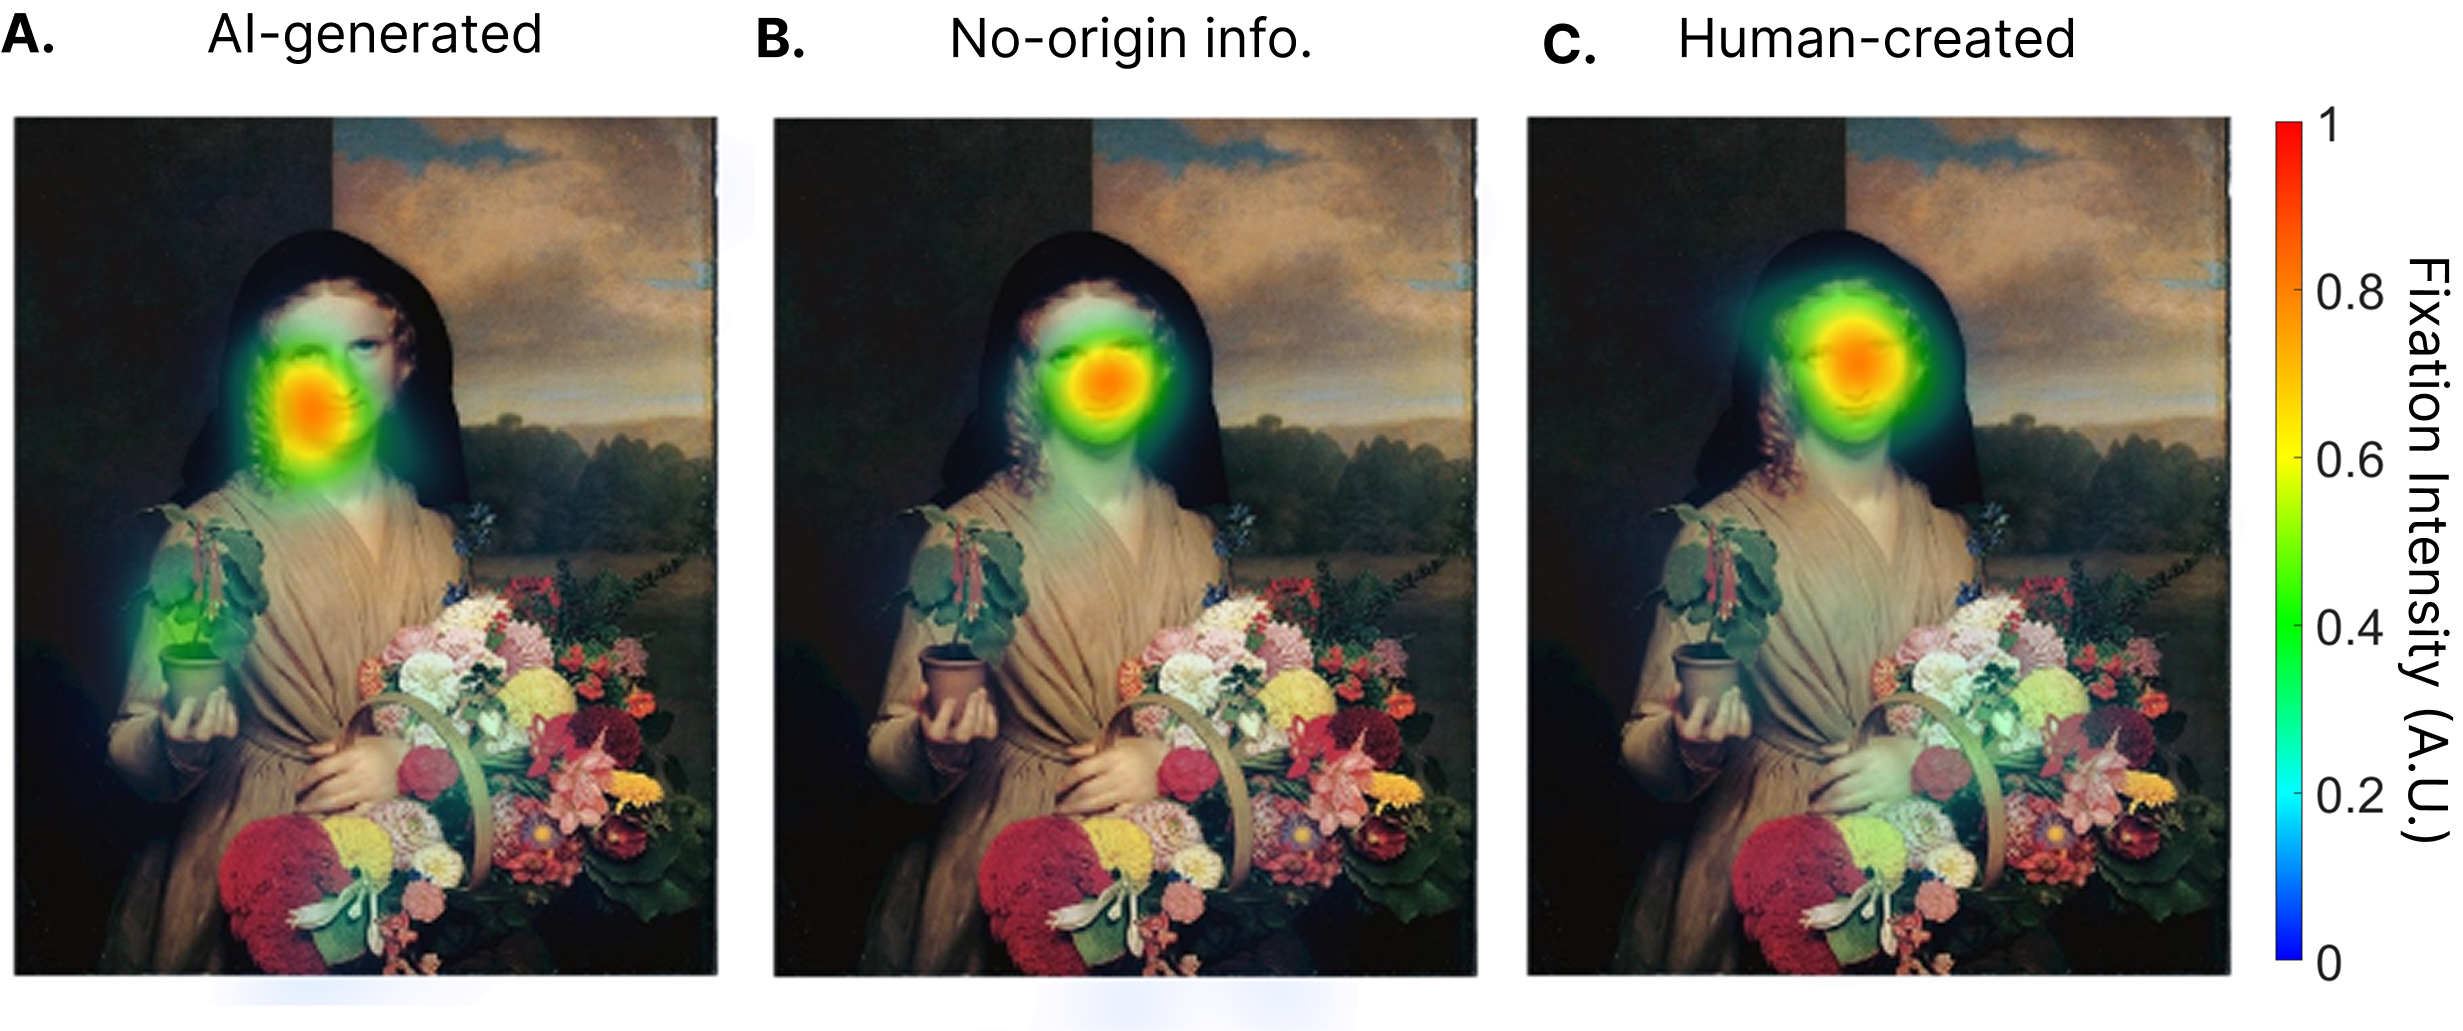
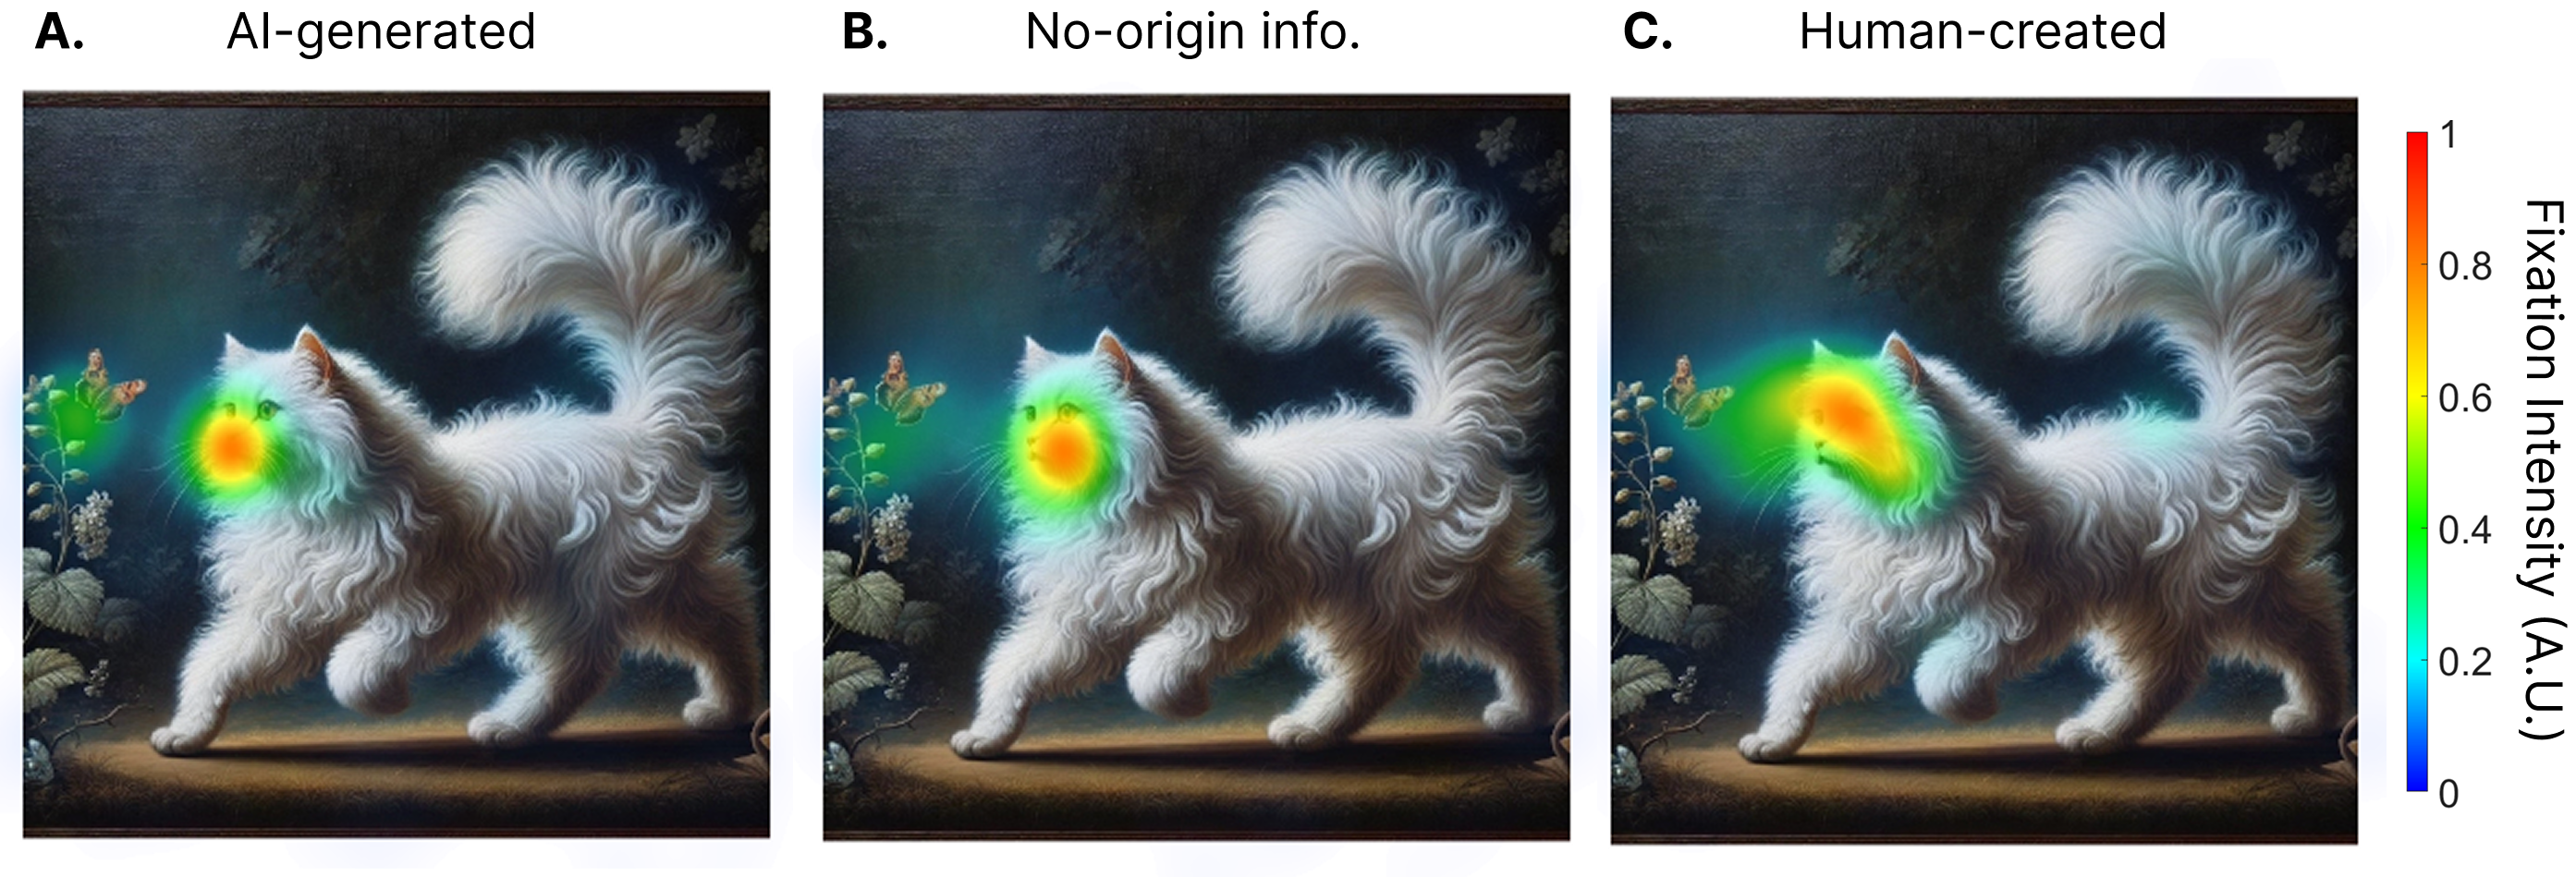
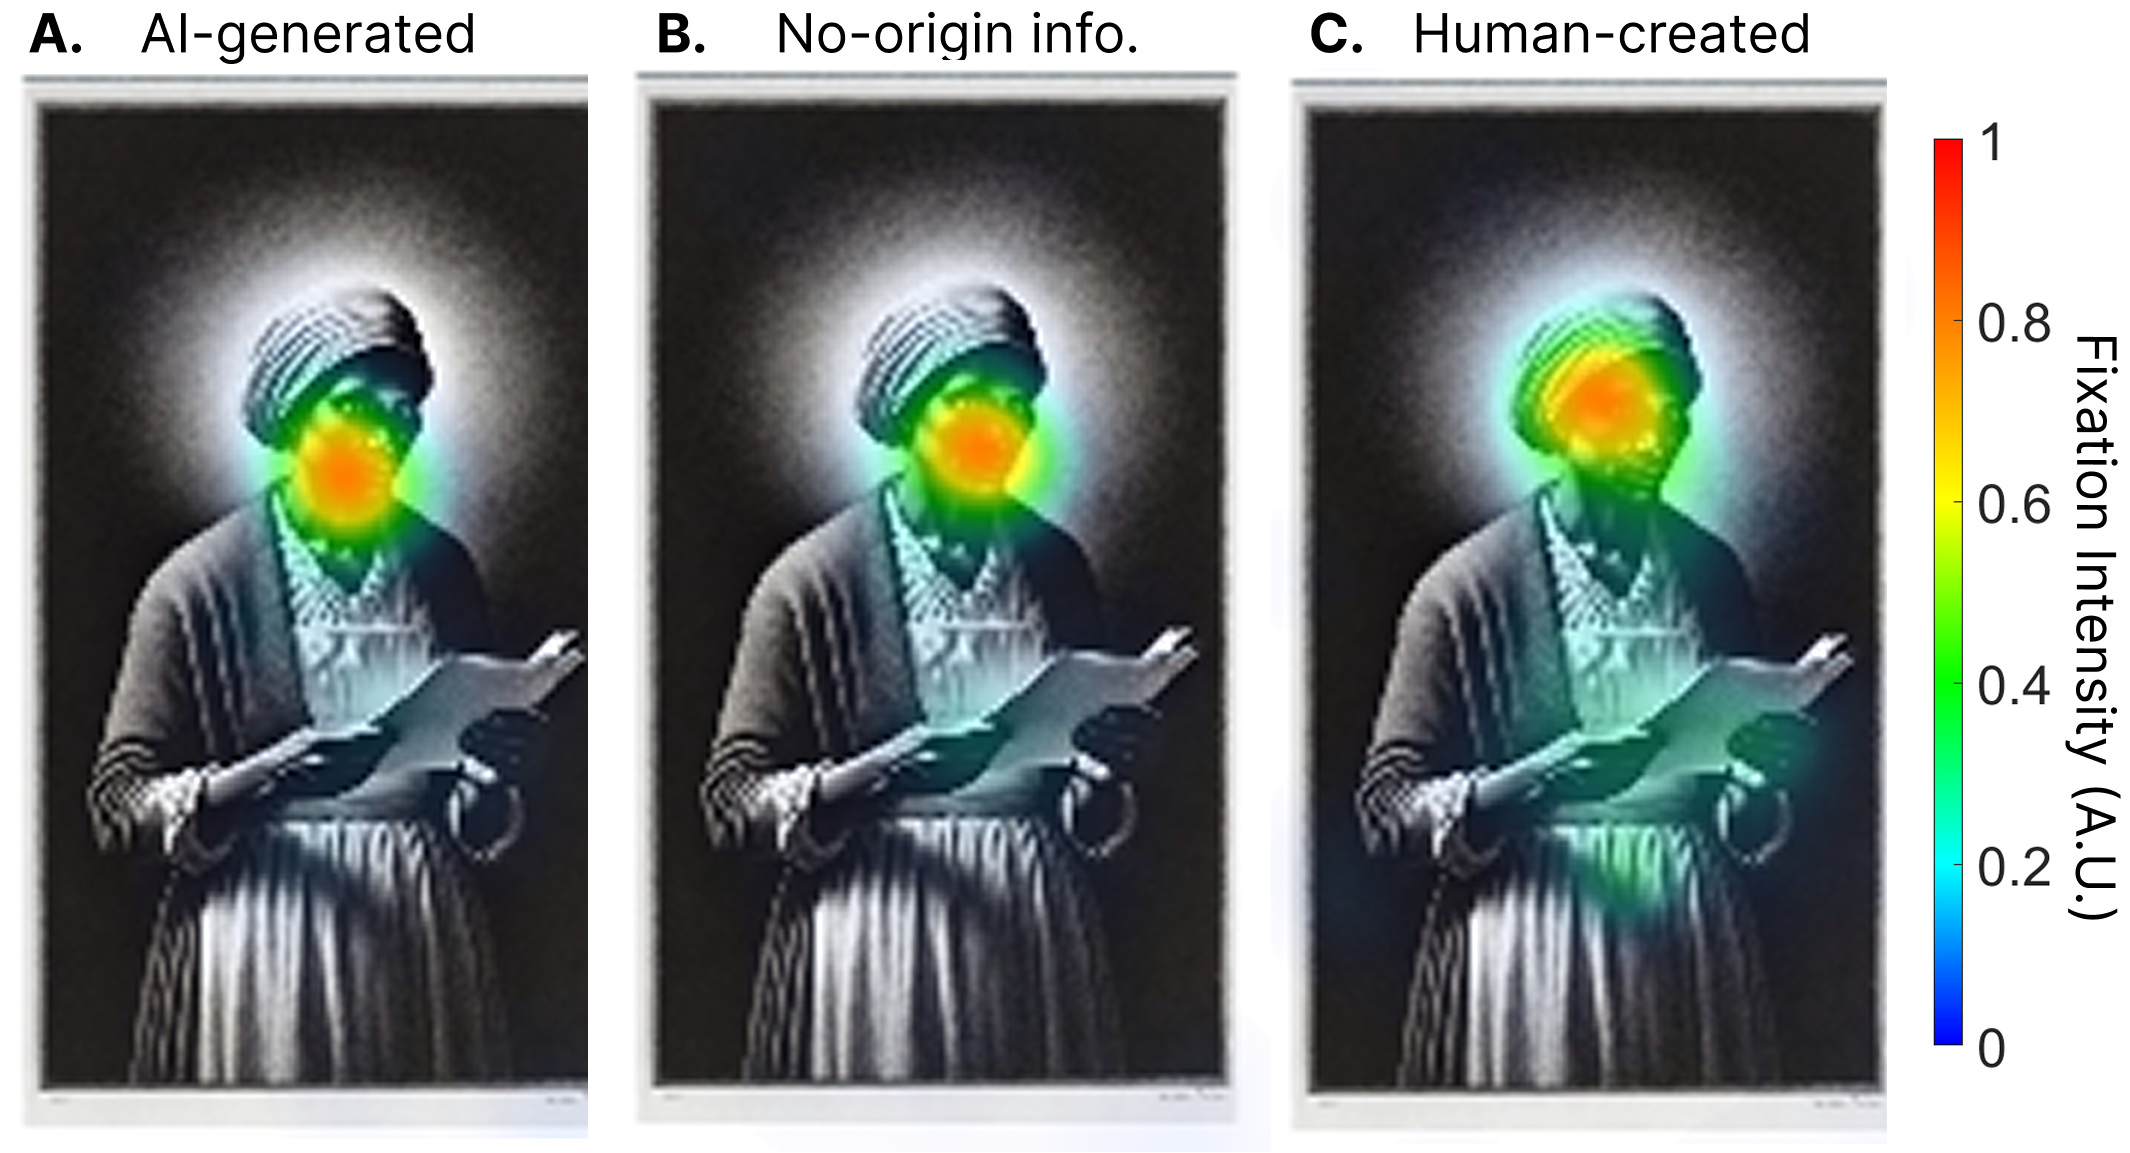
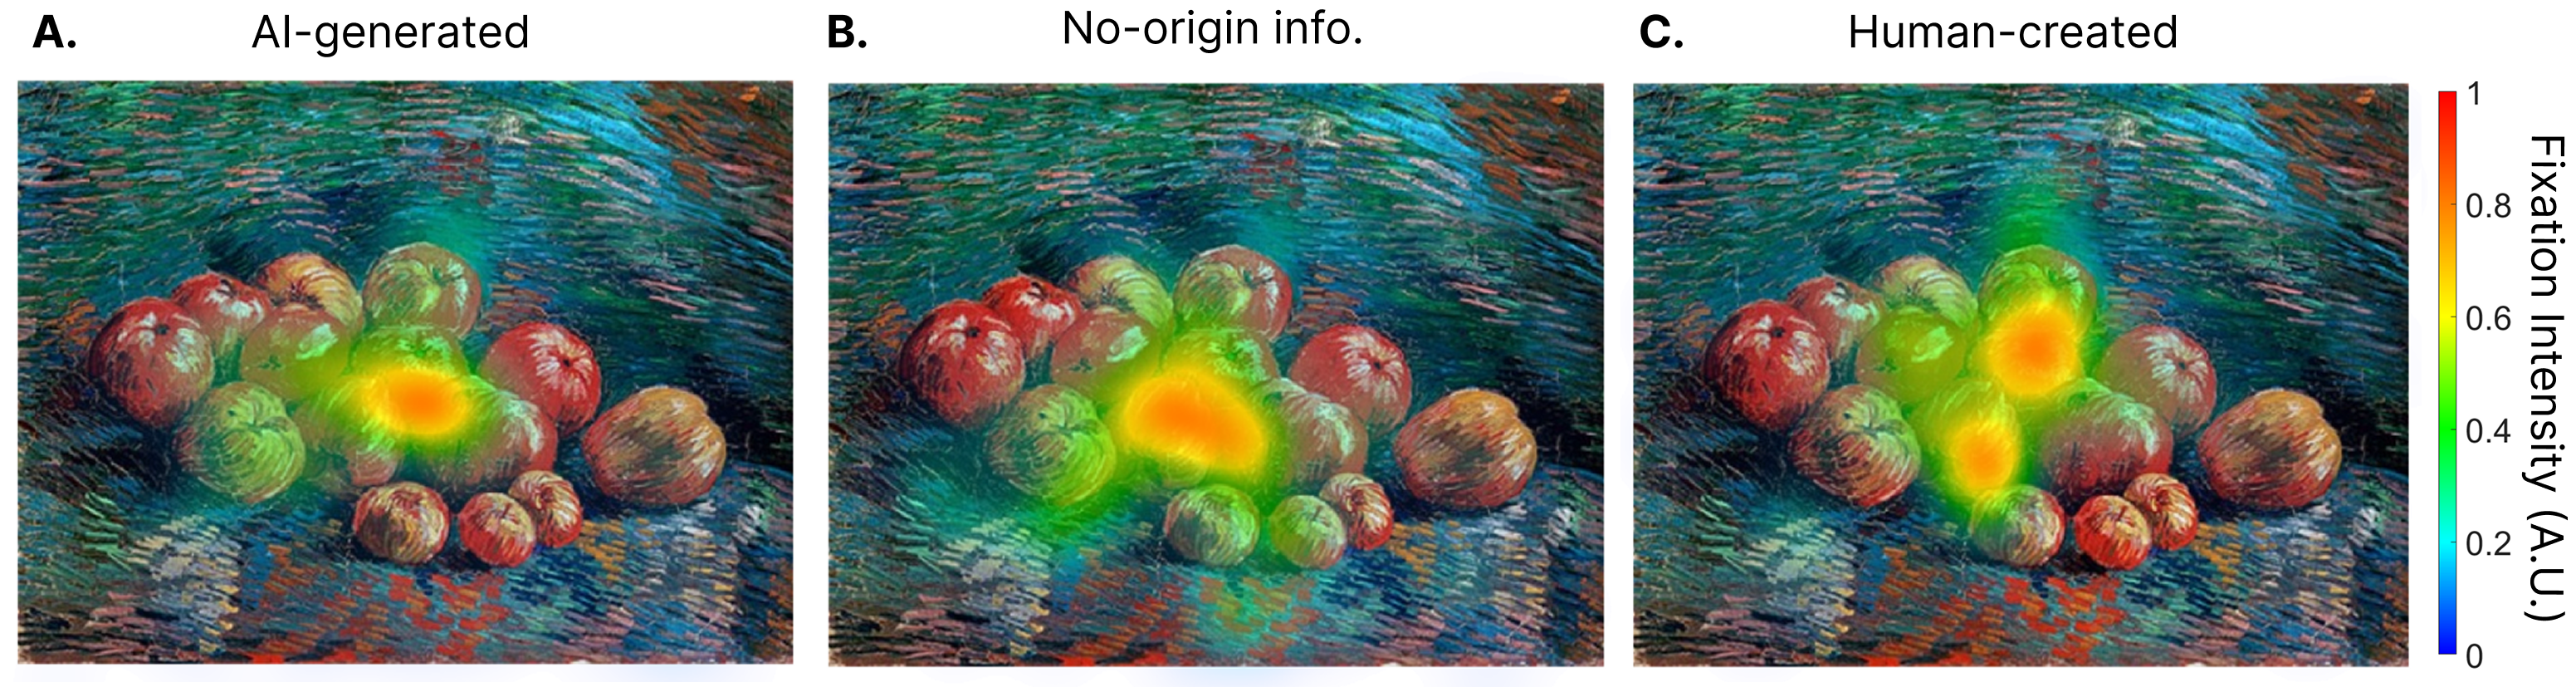
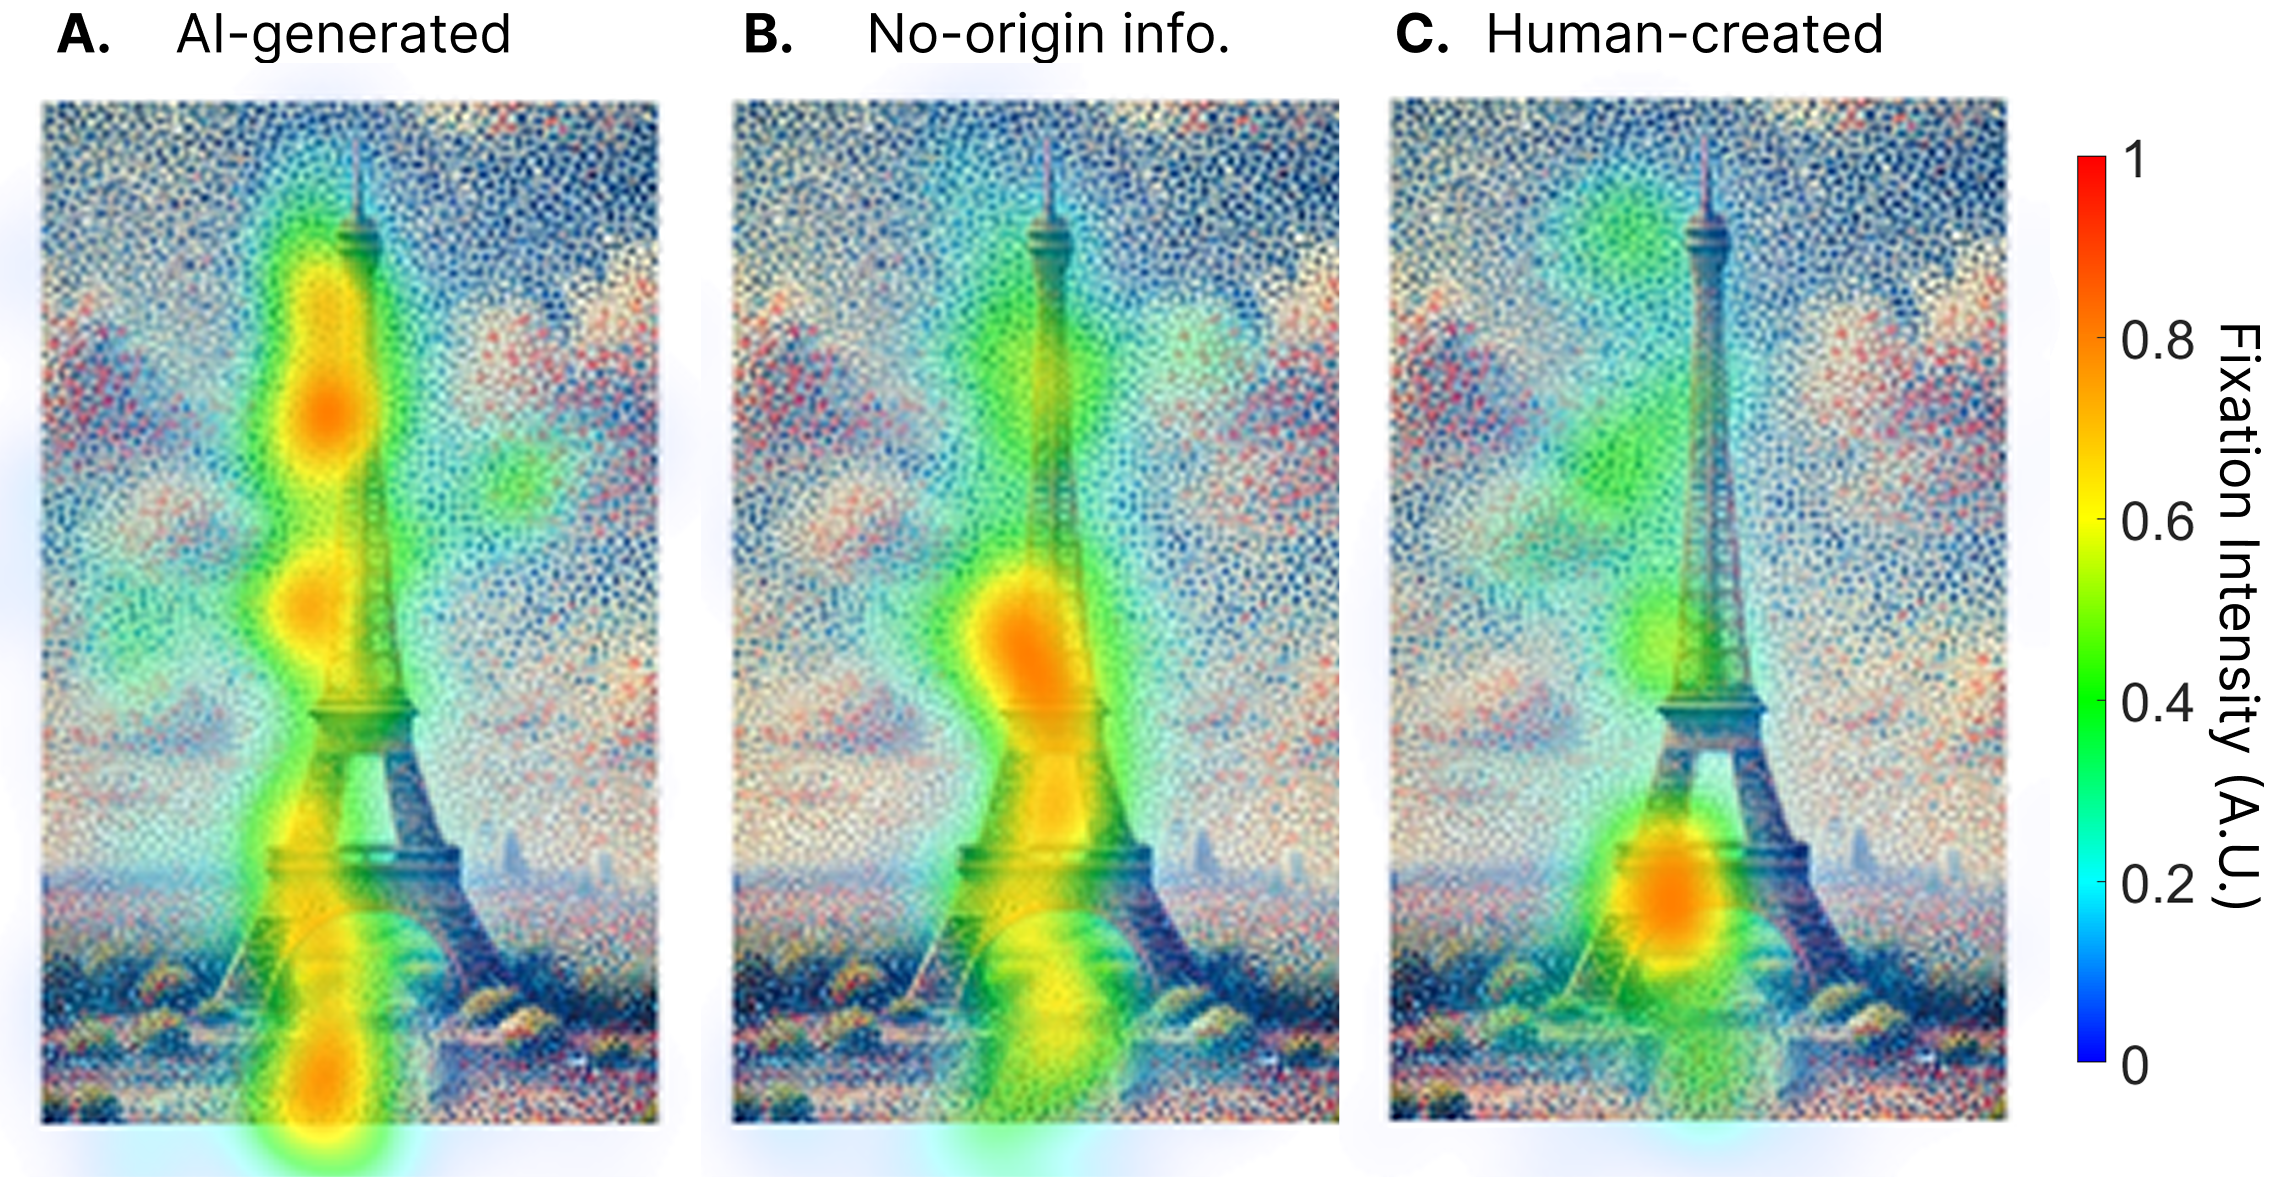
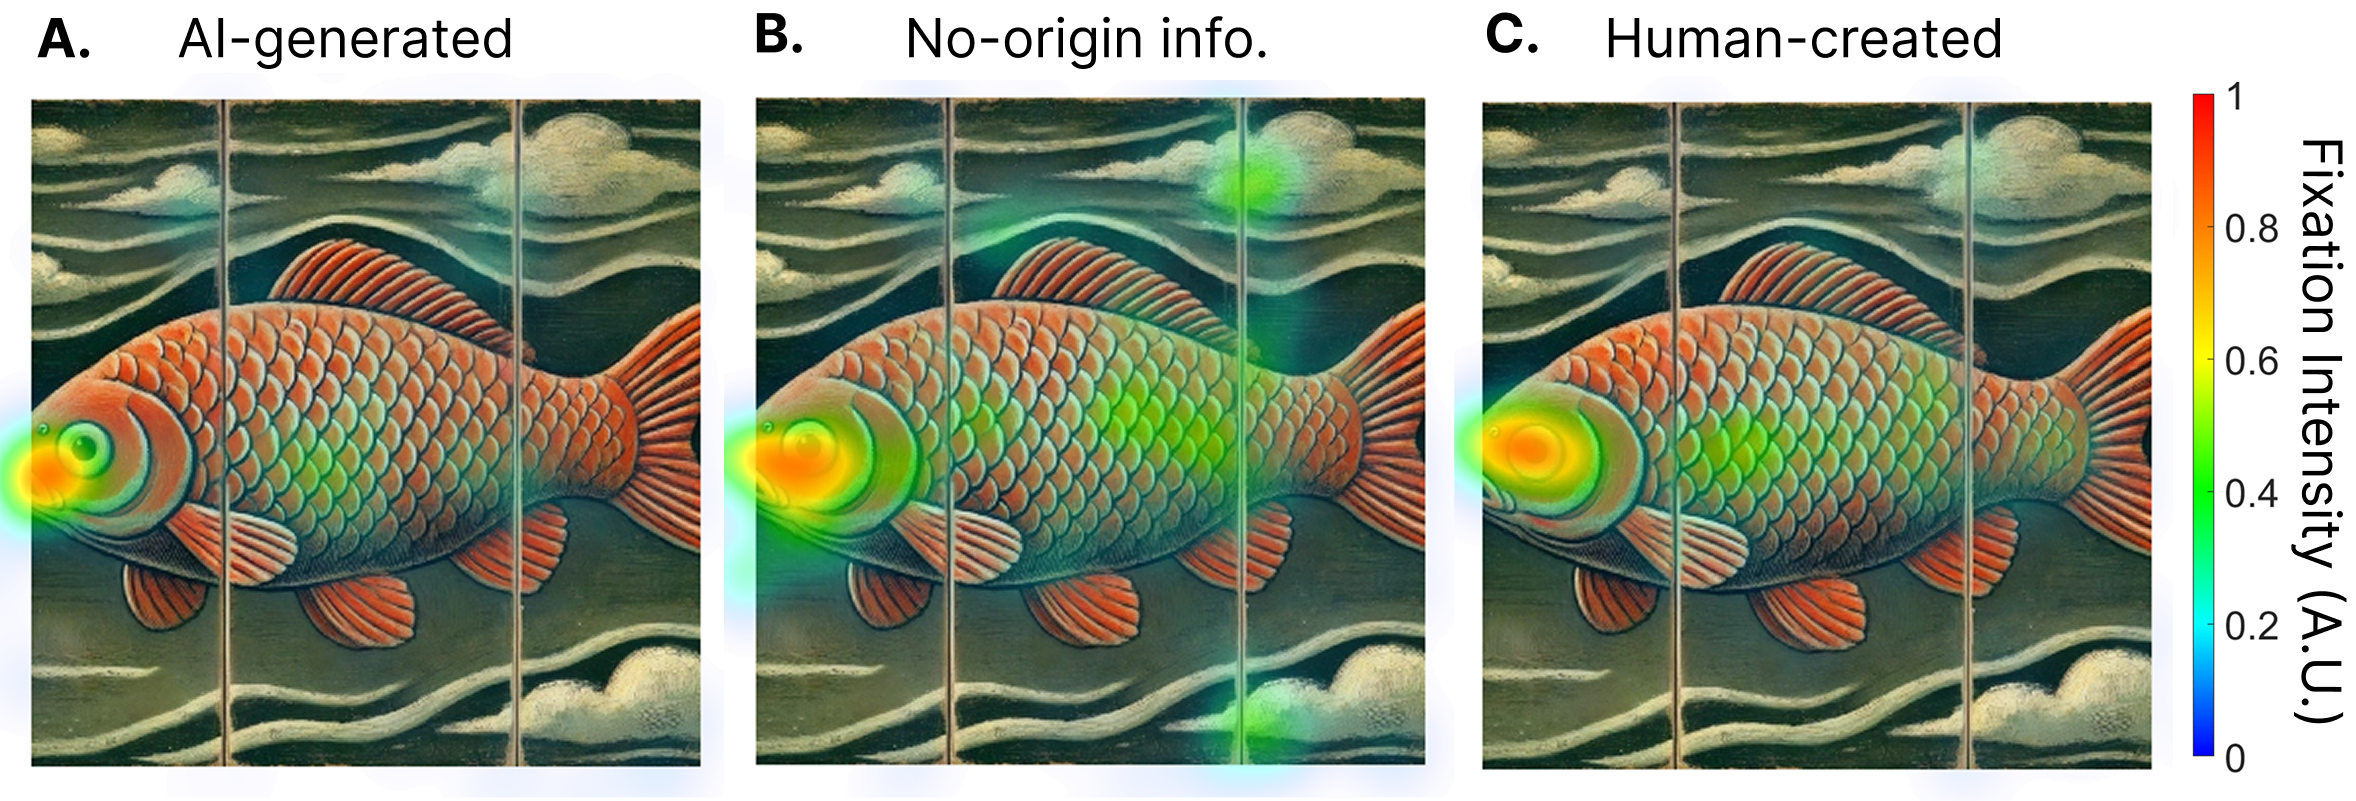
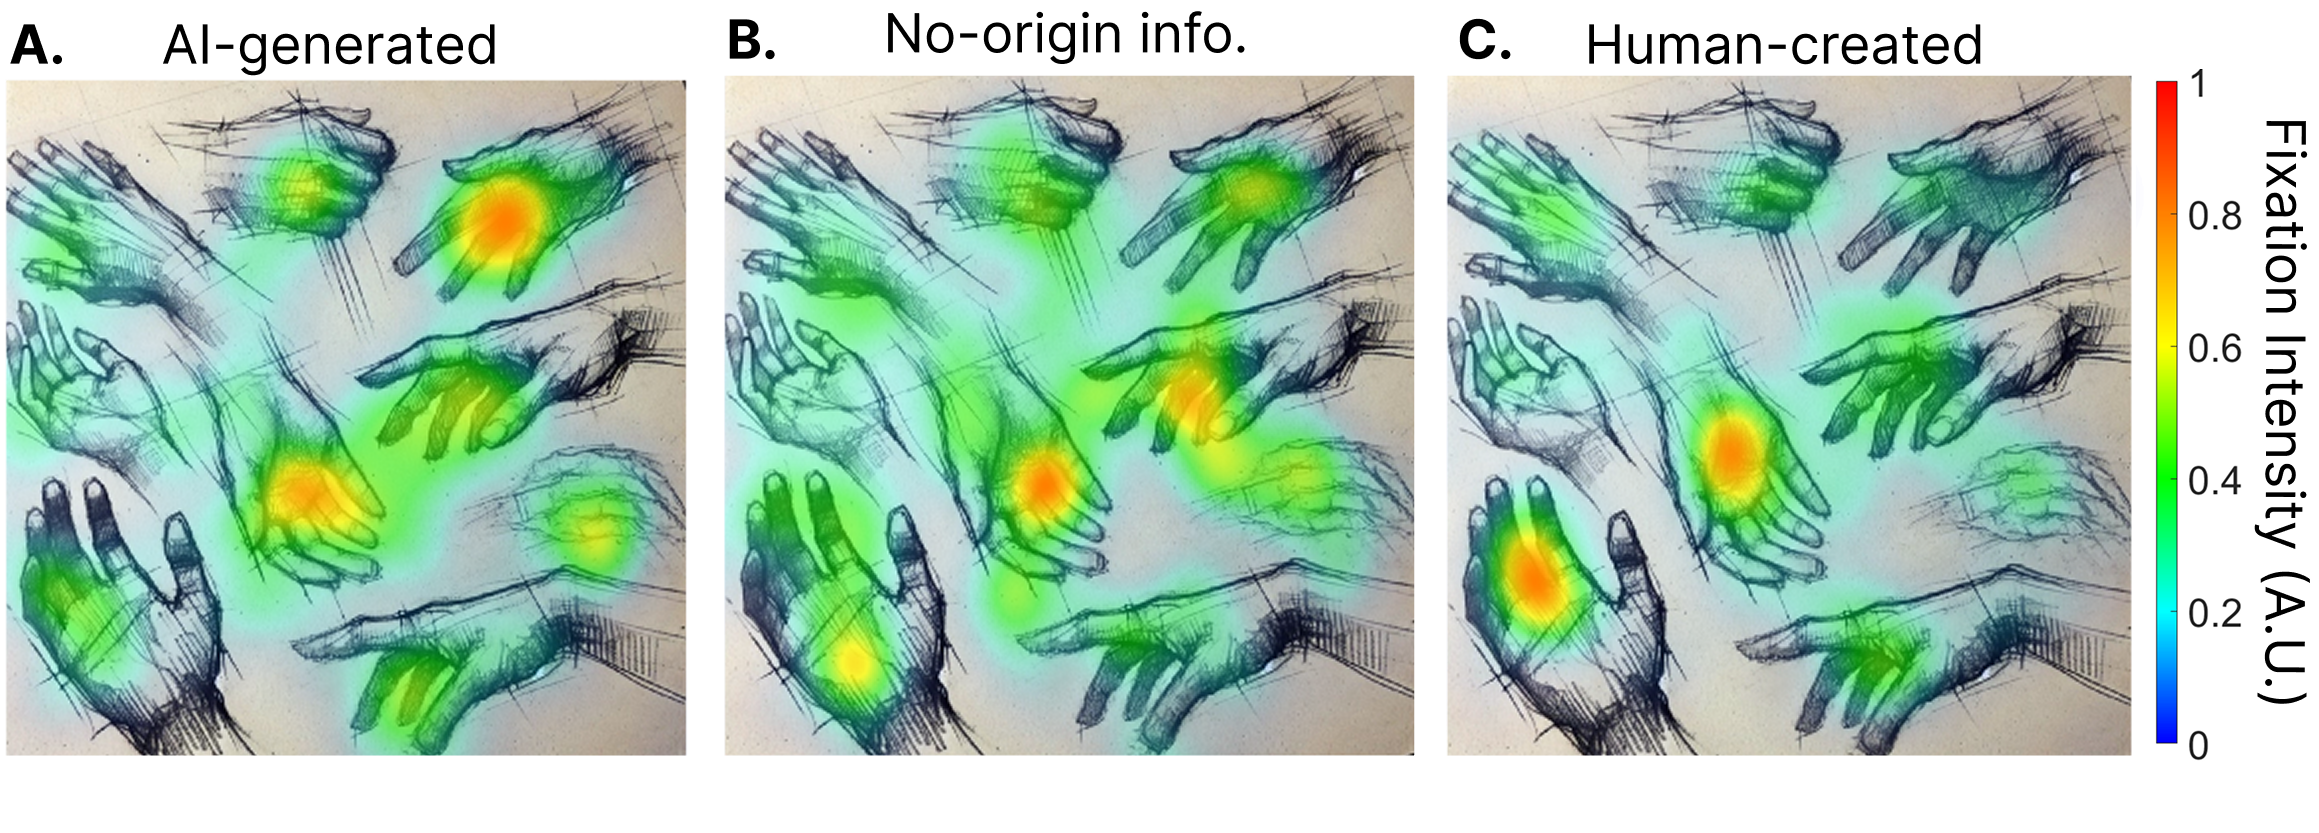
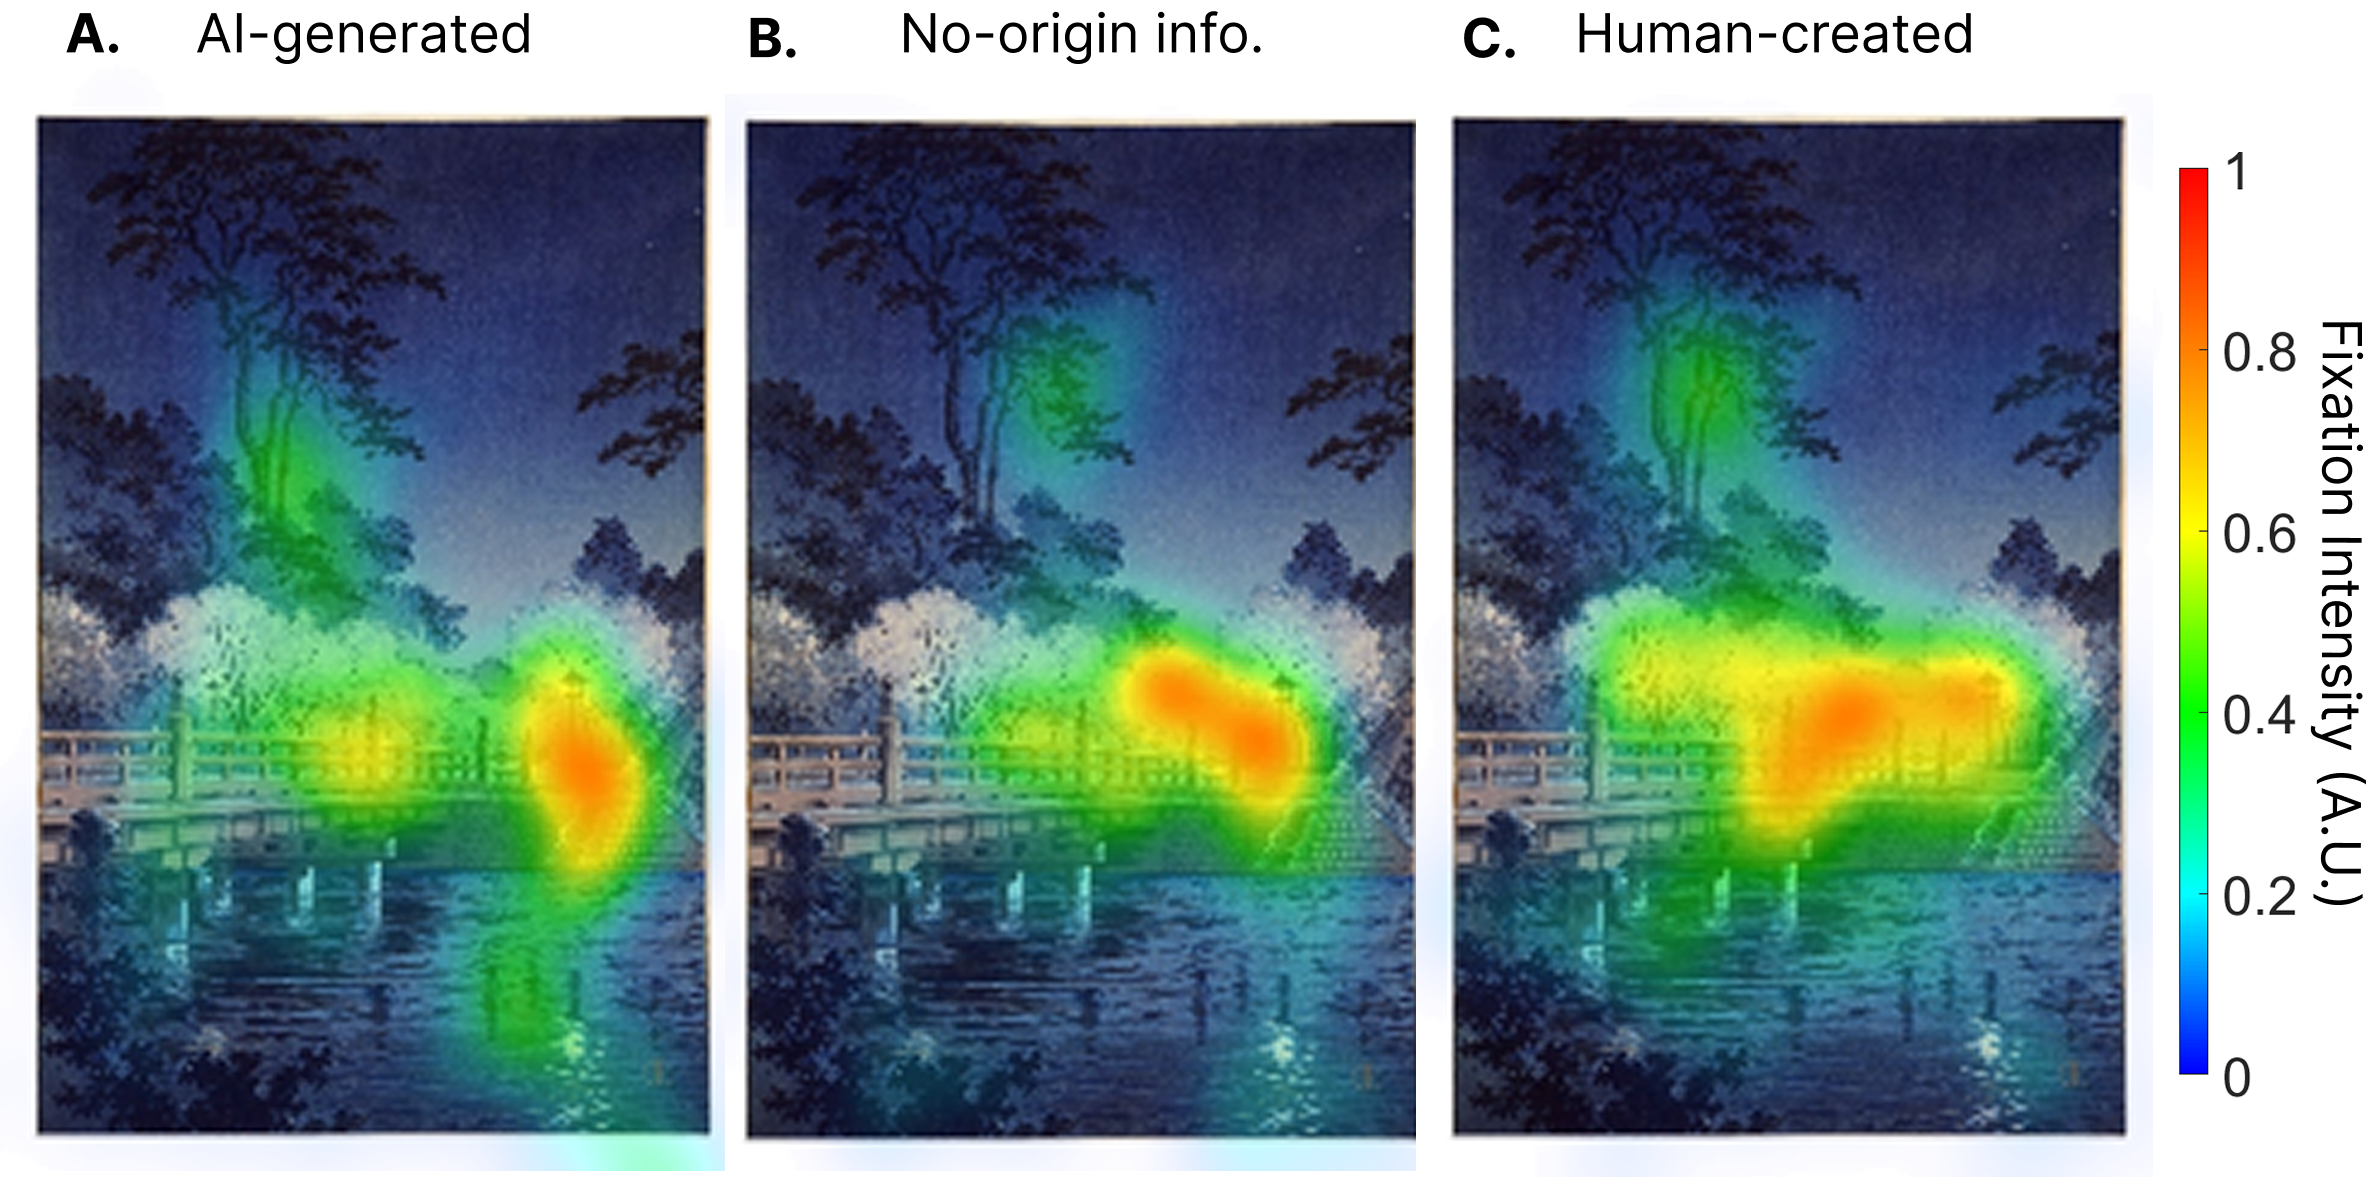
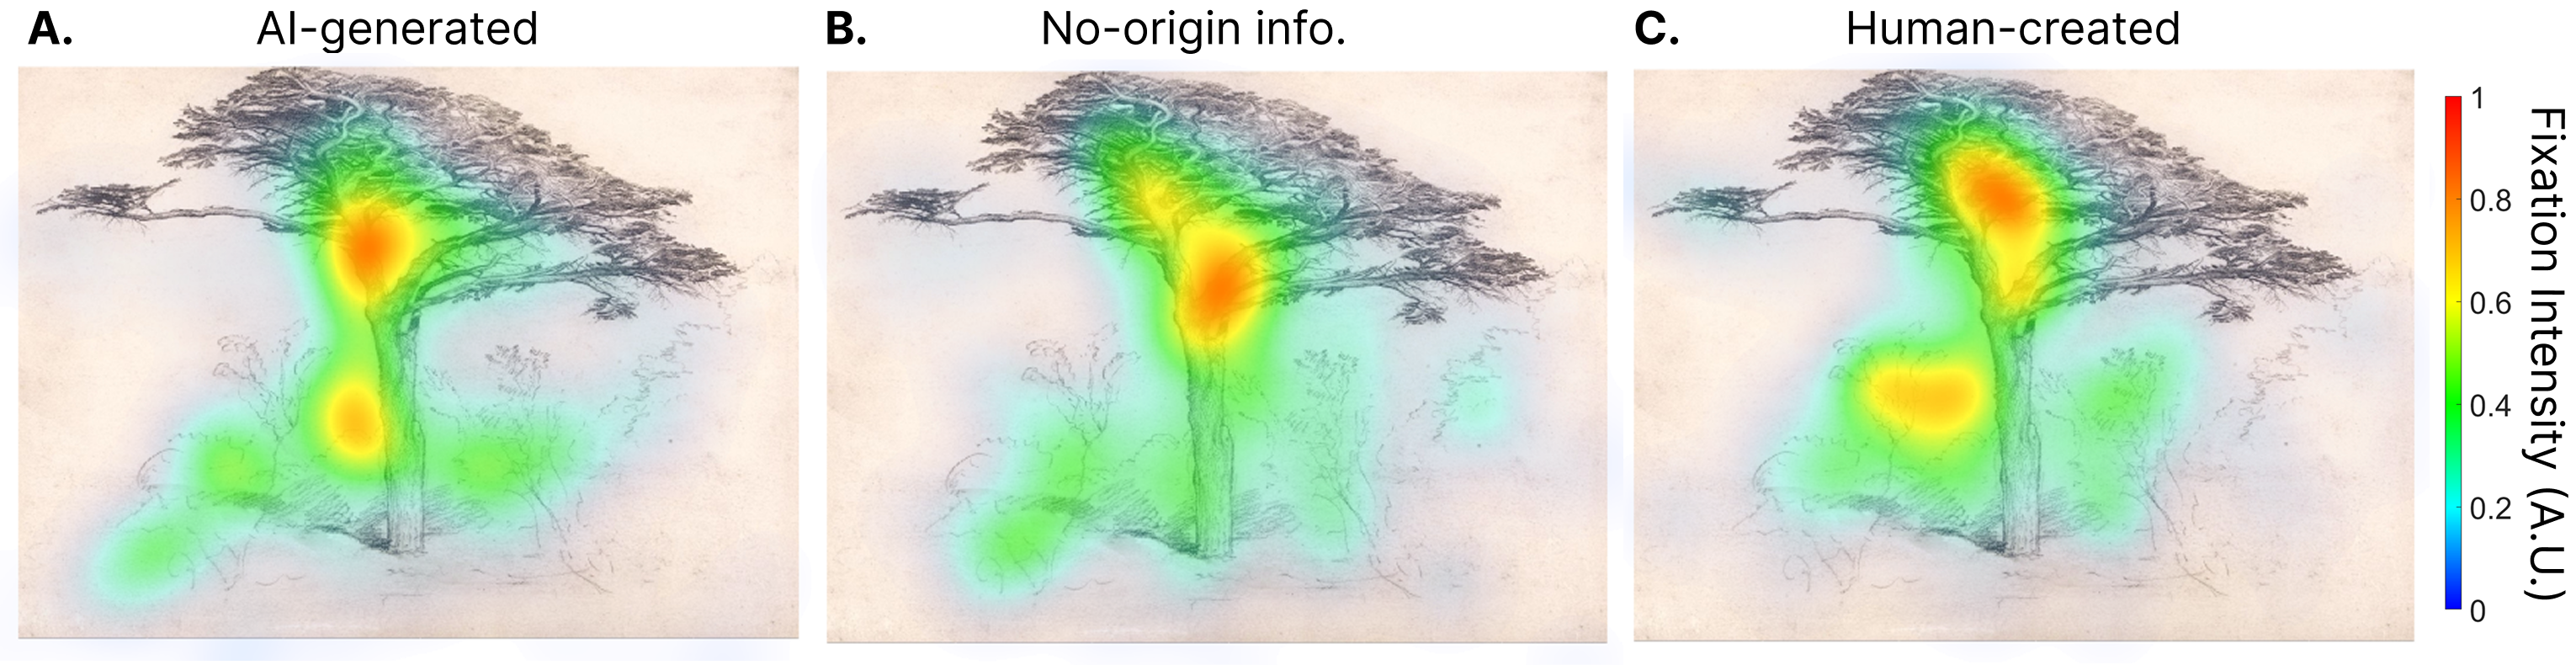
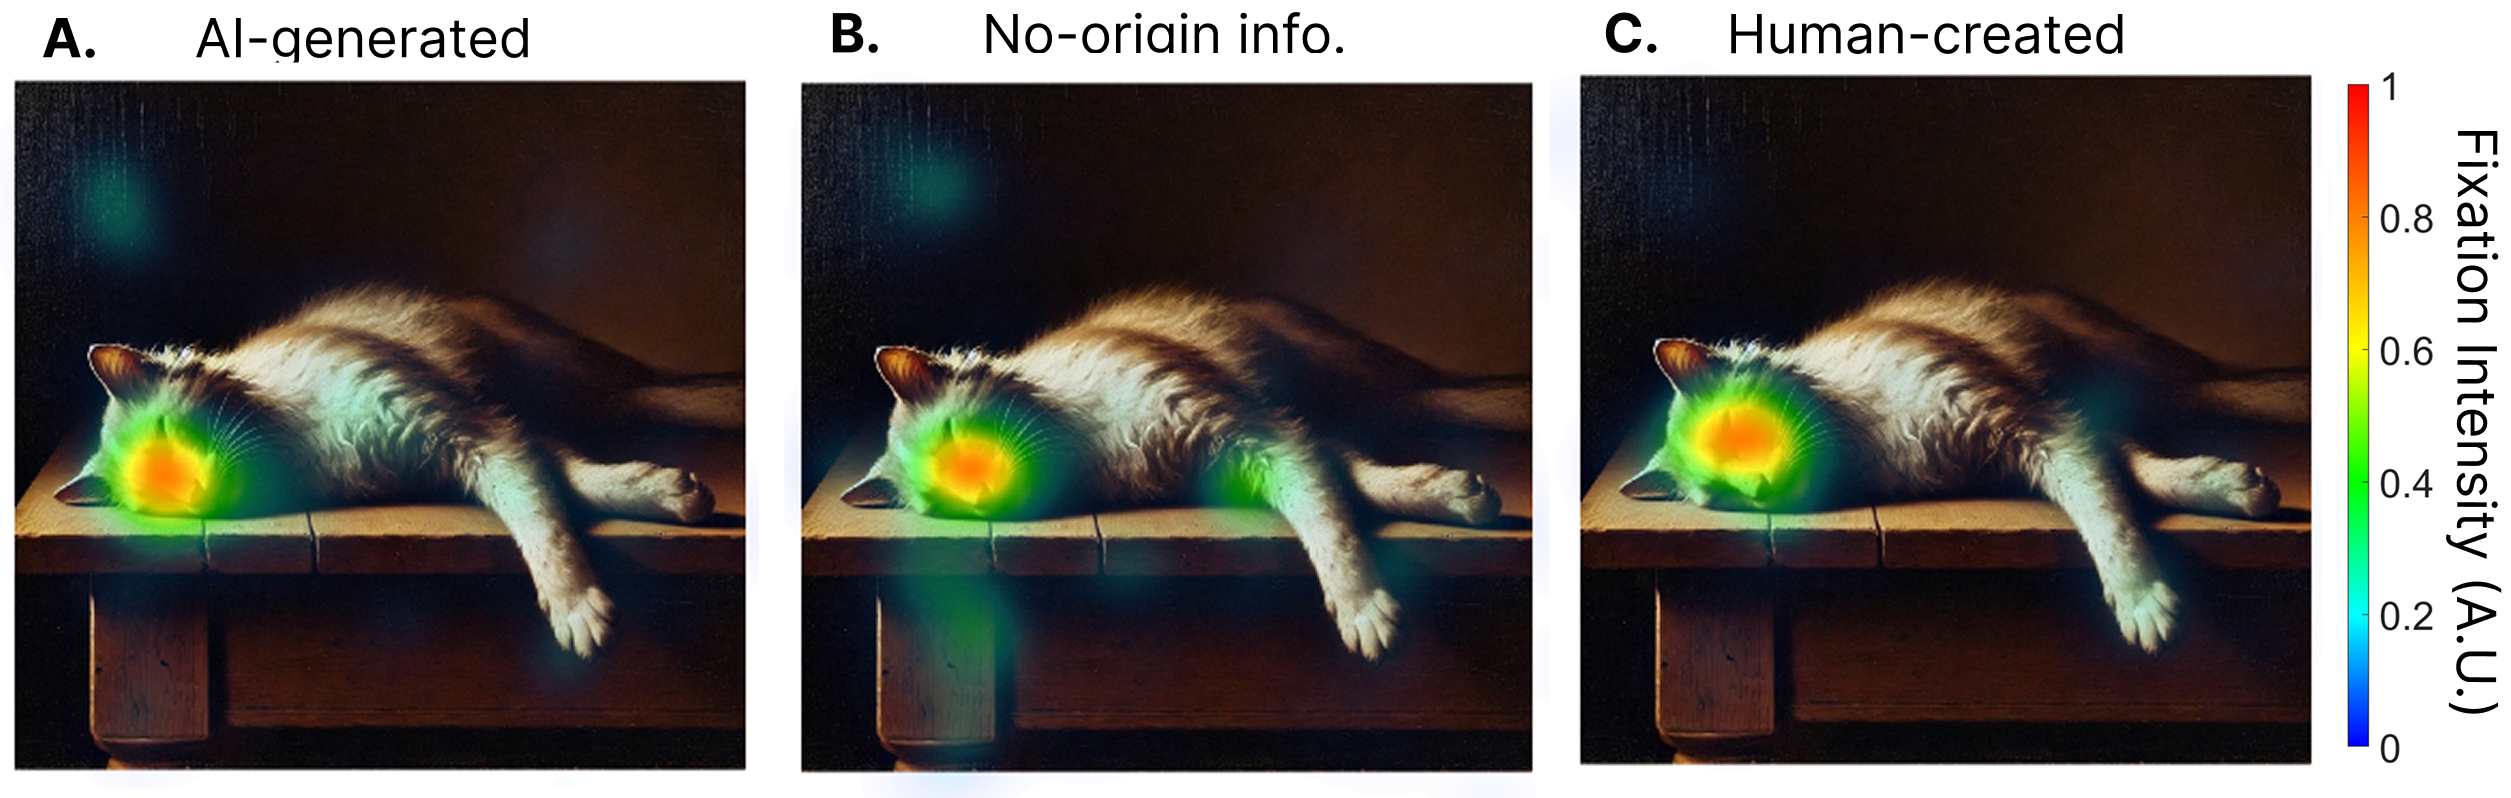
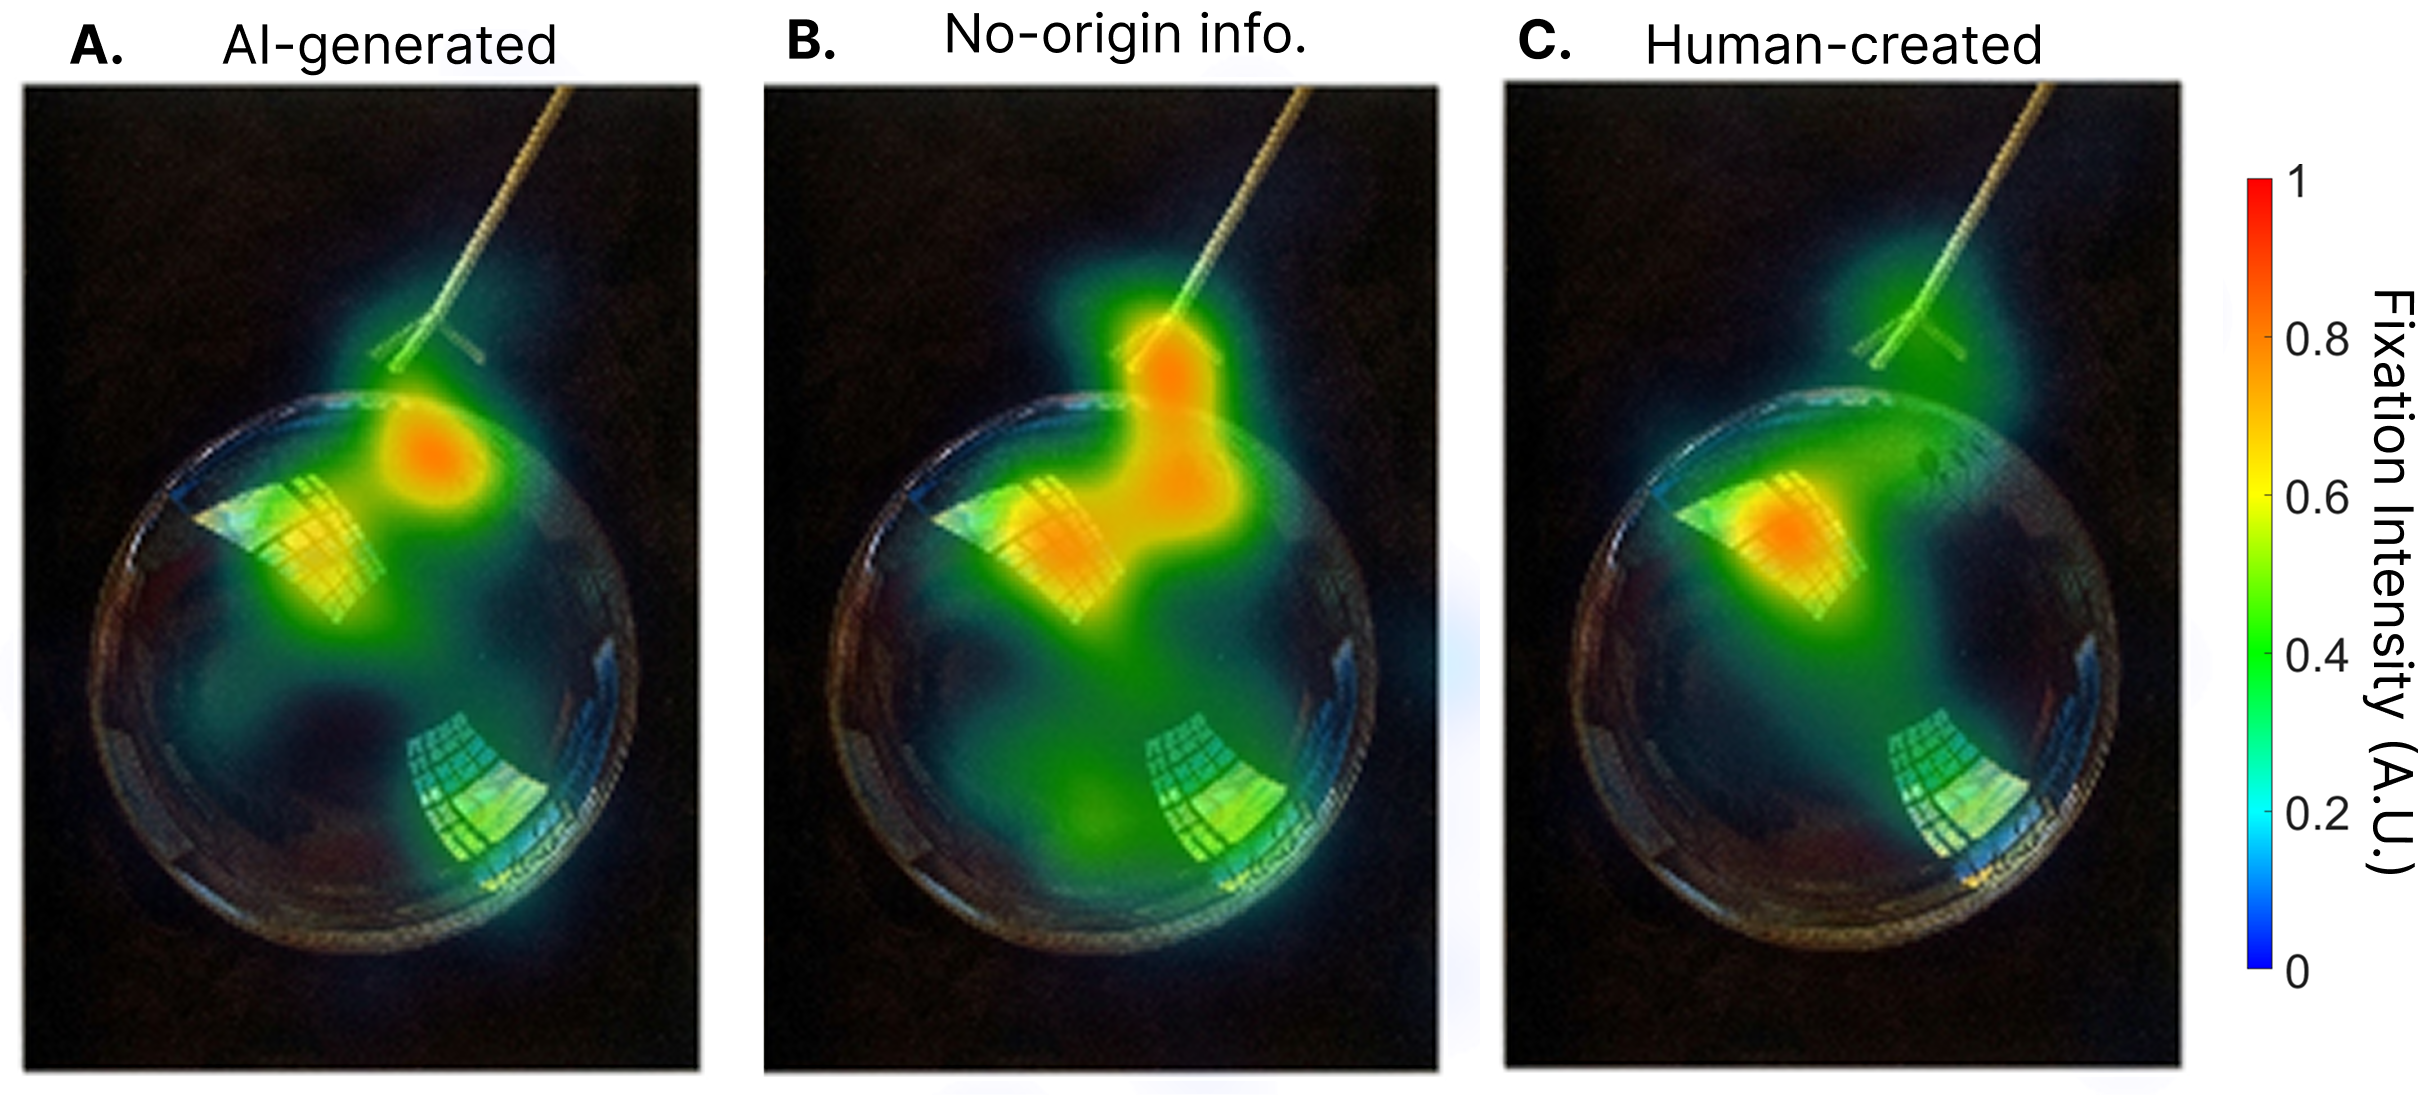
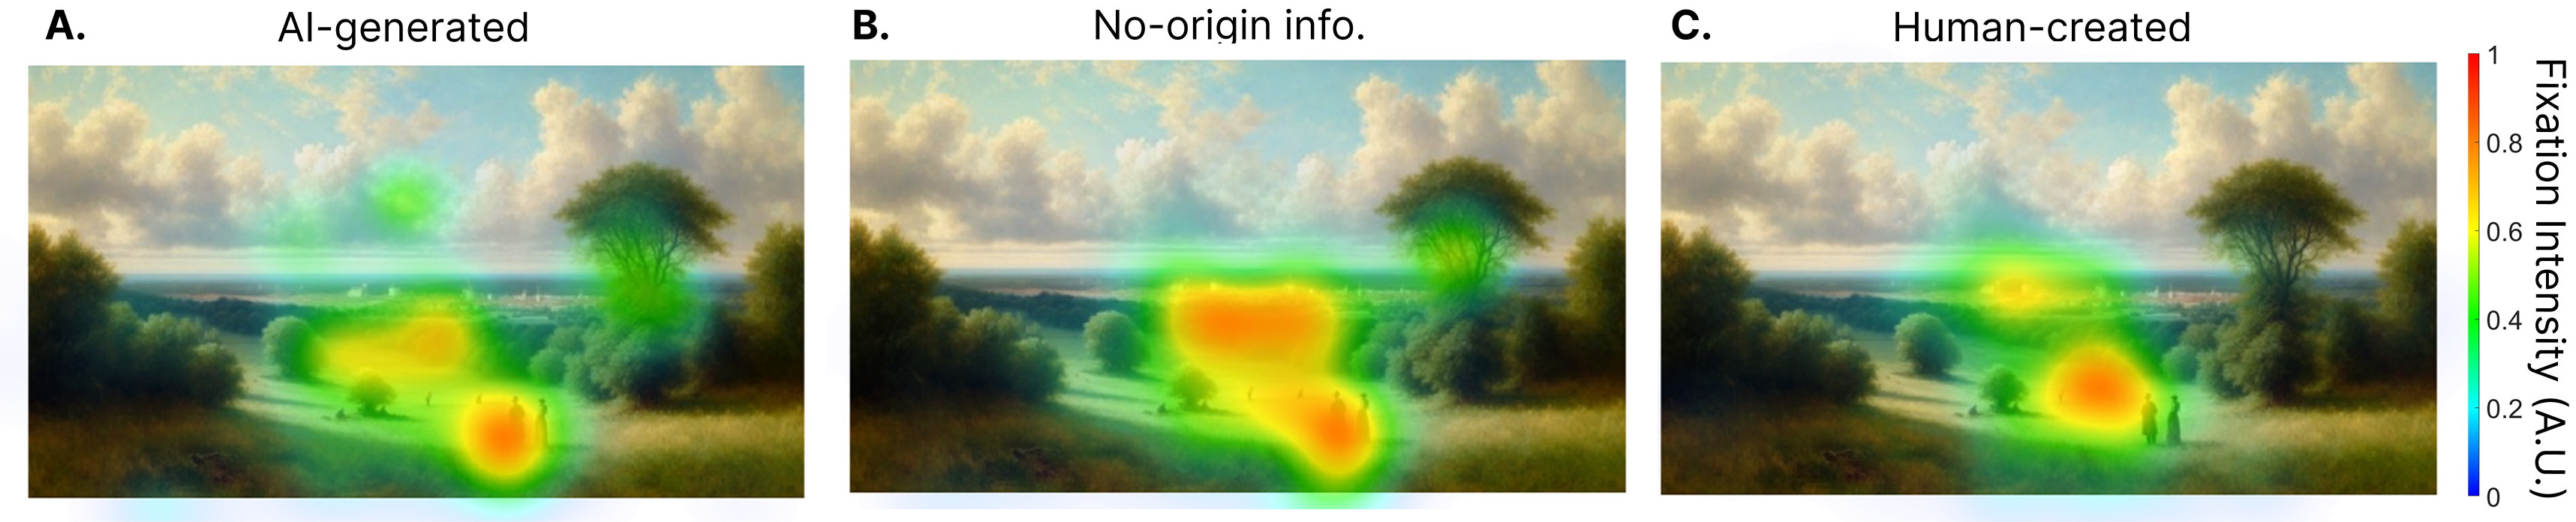
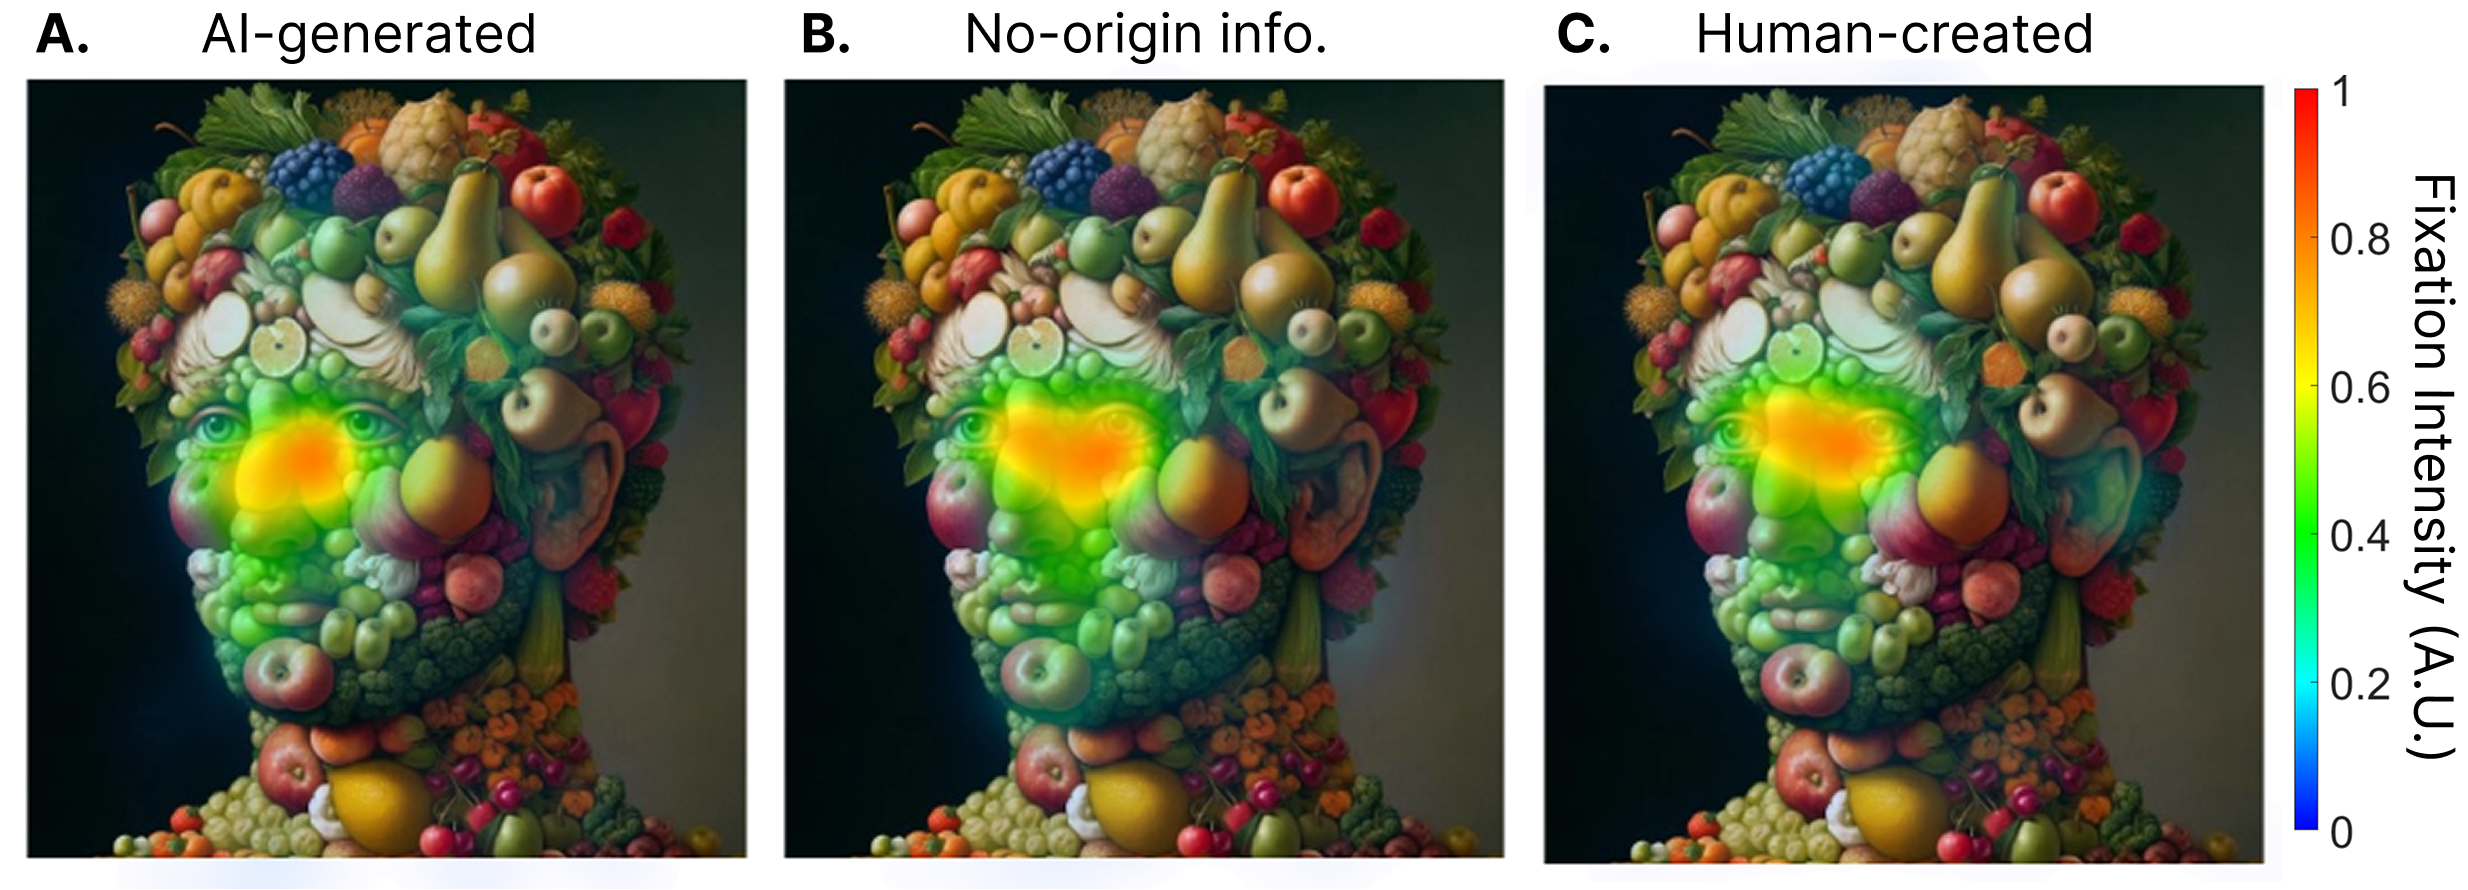
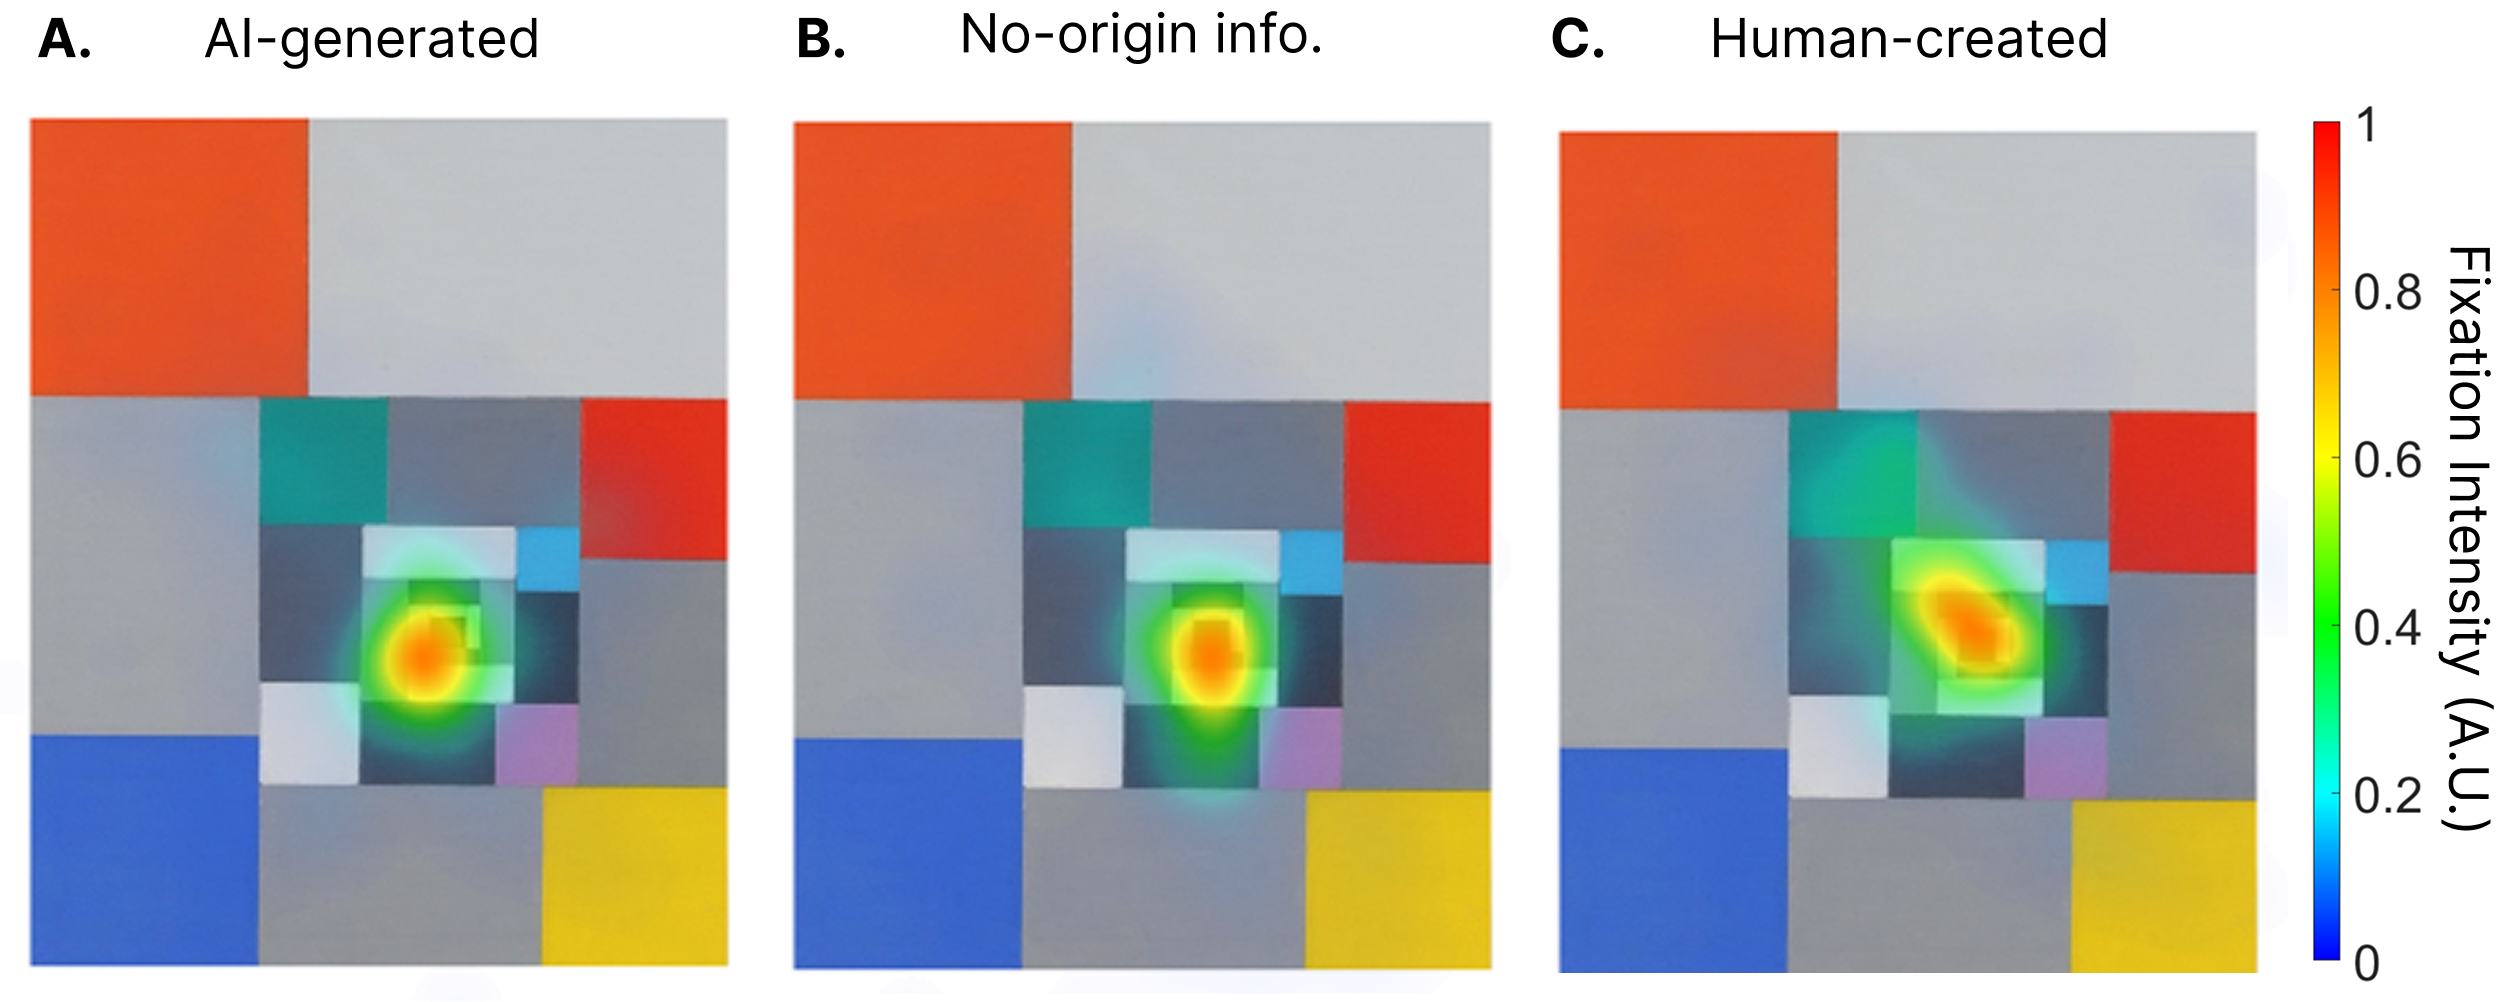
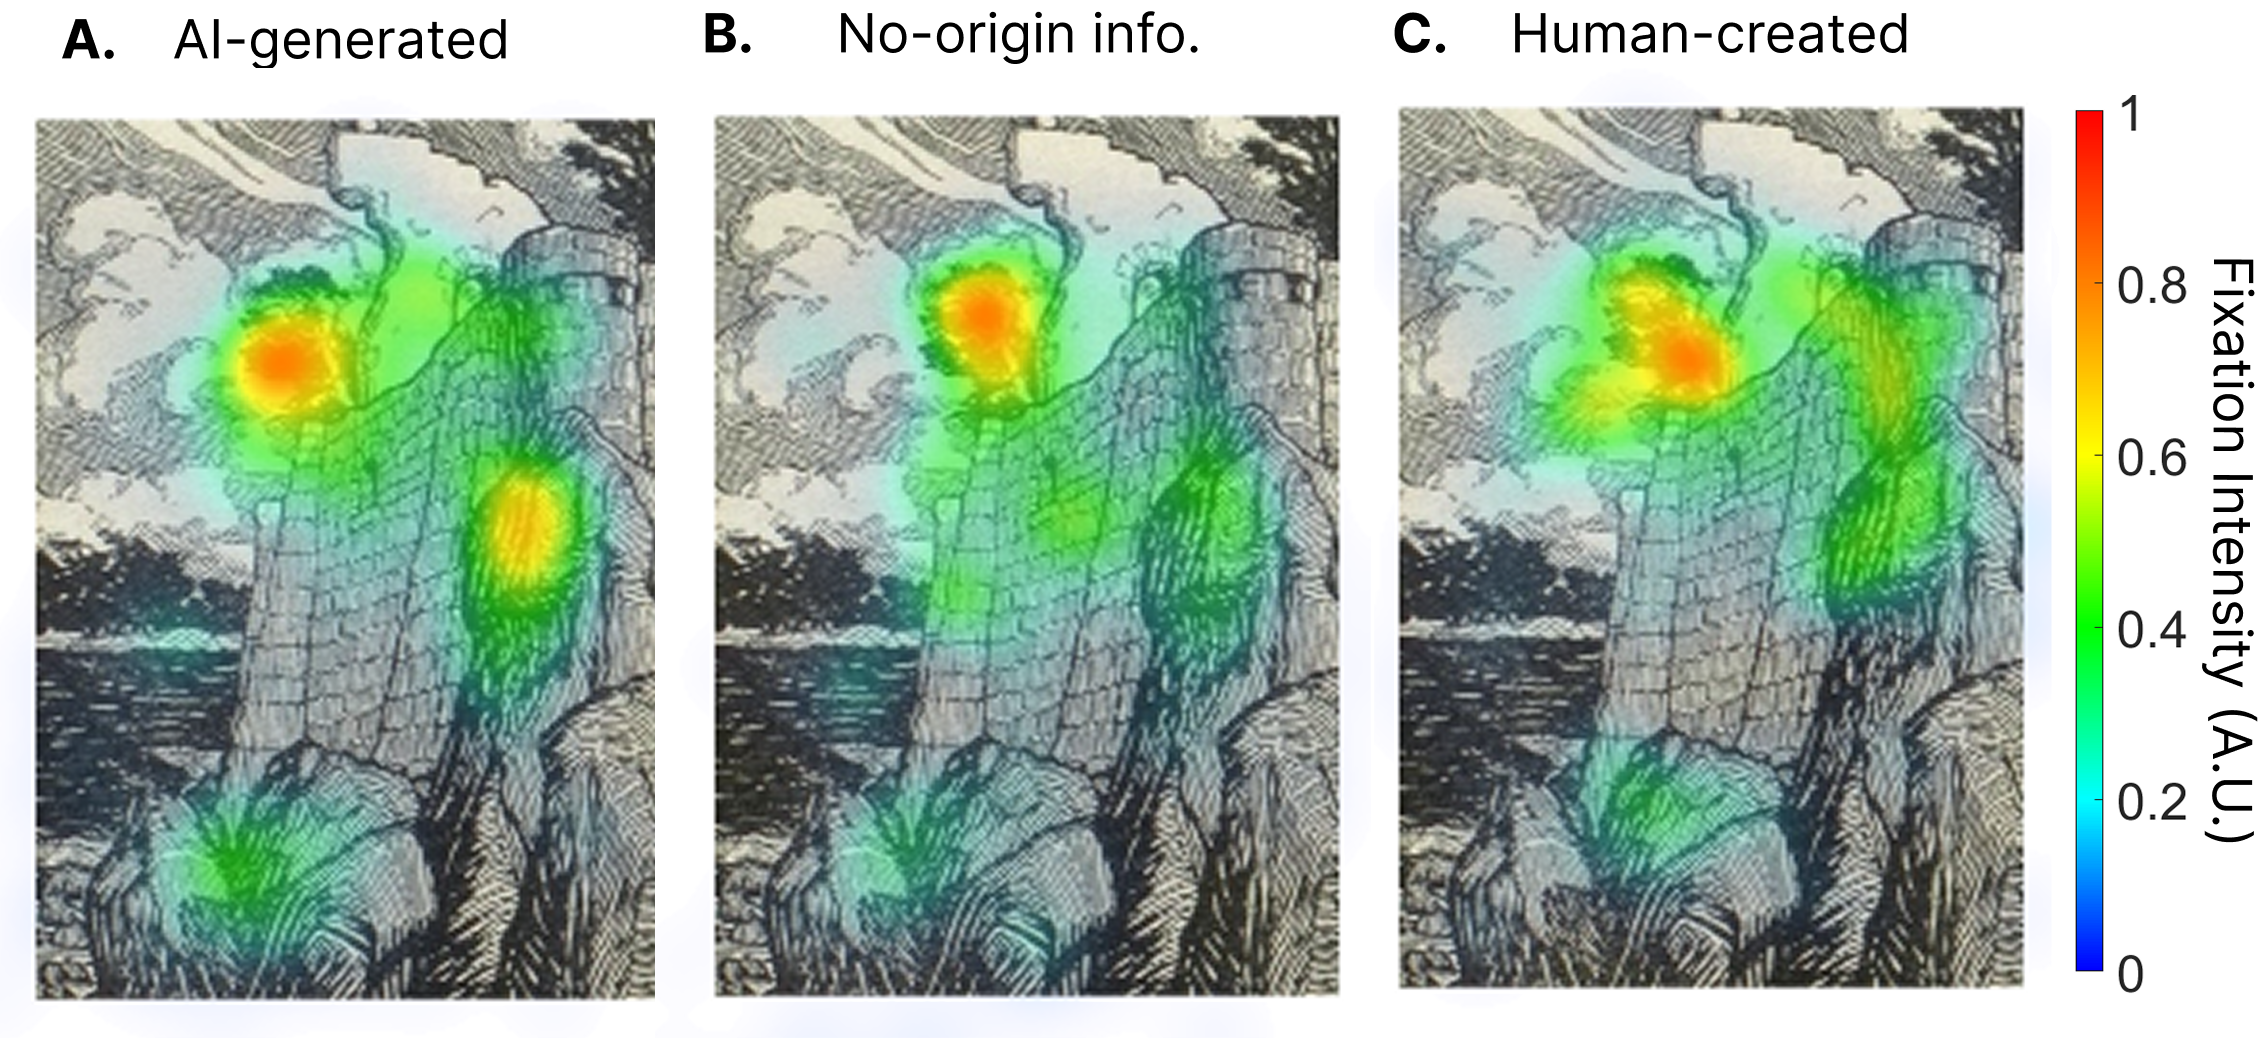
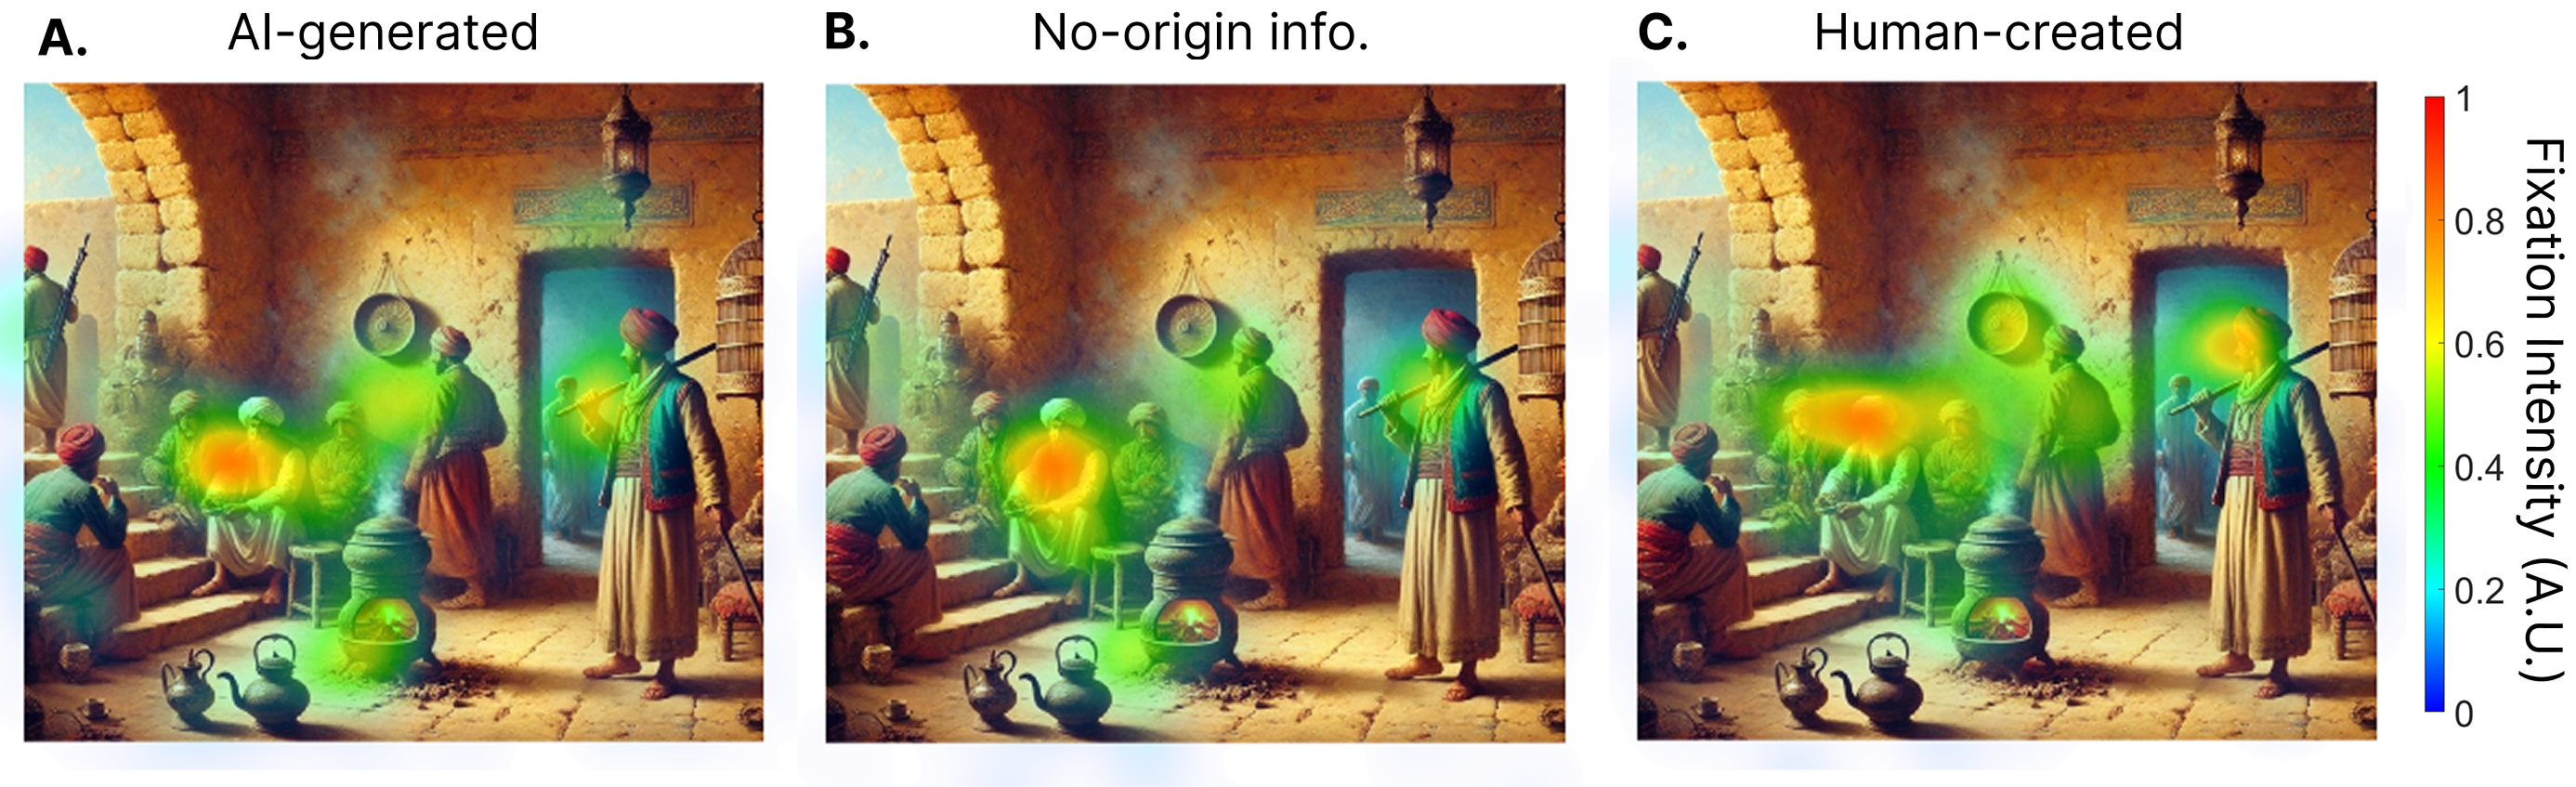
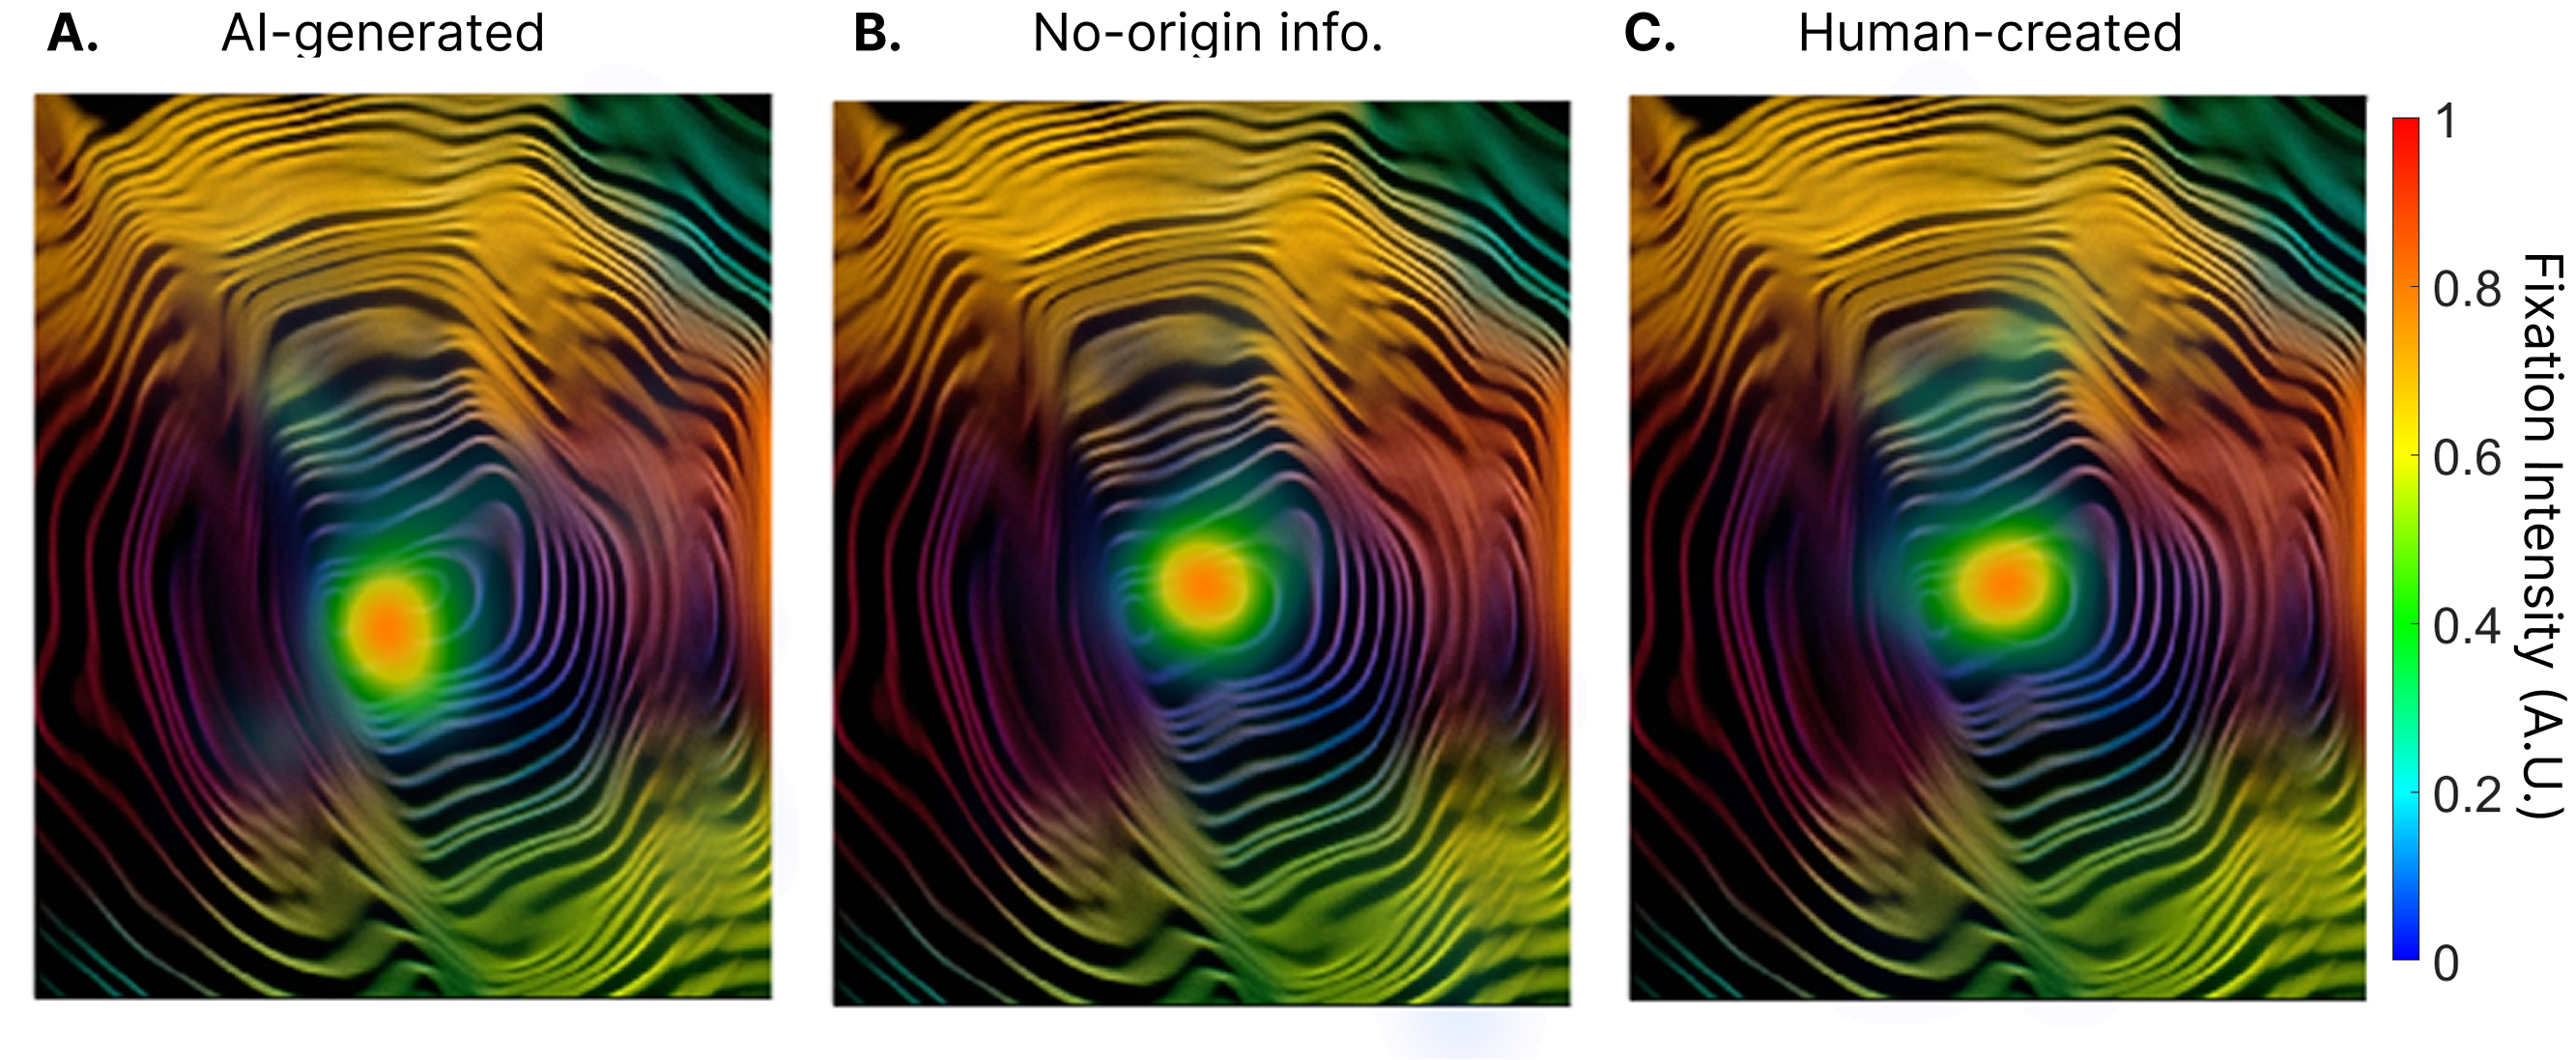
Heatmap Visualizations for each image by Condition
Heatmaps for each of the 40 images in the main experimental curation across conditions (AI-generated, no origin label, and Human-created). Fixation intensity is represented as aribitraty units (A.U.), with more intense areas of fixation represented as warmer (more red) colors, and less intense areas of fixation represented as cooler (more blue) colors. Clicking on a figure will open an enlarged version of the figure in a new tab.